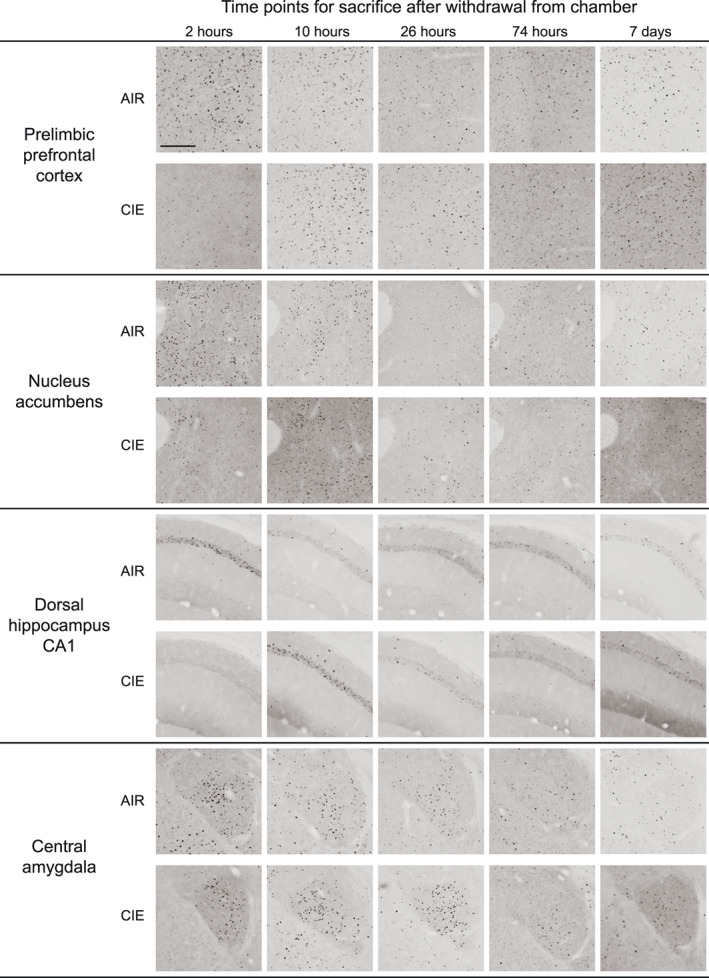
FIGURE 3.

Representative images of c‐Fos expression for AIR‐ and CIE‐exposed mice at all withdrawal time points (2, 10, 26, and 74 hours or 7 days) in prelimbic prefrontal cortex, nucleus accumbens, dorsal hippocampus CA1, and central amygdala. Scale bar on first image = 200 μm
