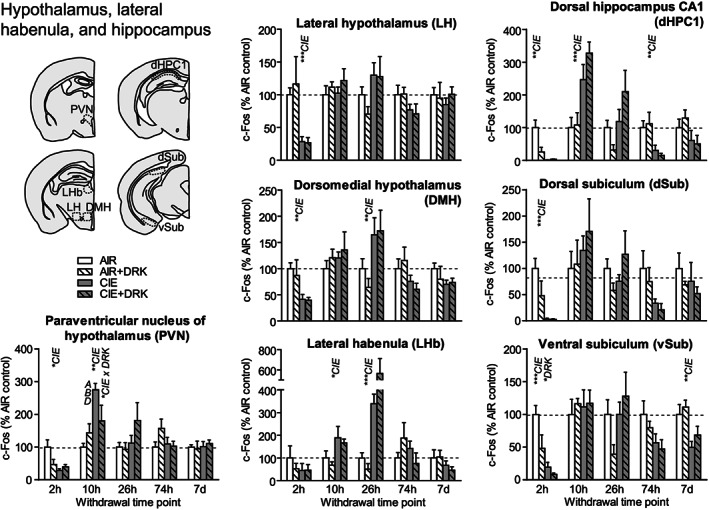
FIGURE 7.

c‐Fos expression in hypothalamus, lateral habenula, and hippocampus following various withdrawal time points. Significant main effects for chronic intermittent ethanol (CIE), ethanol drinking (DRK), and interactions (CIE × DRK) are shown for each time point (* P < .05, ** P < .01, *** P < .001, **** P < .0001); significant post hoc comparisons are represented by letters above a given bar indicating to which other bar a significant difference was observed (eg, A = first bar, B = second bar)
