Fig. 1.
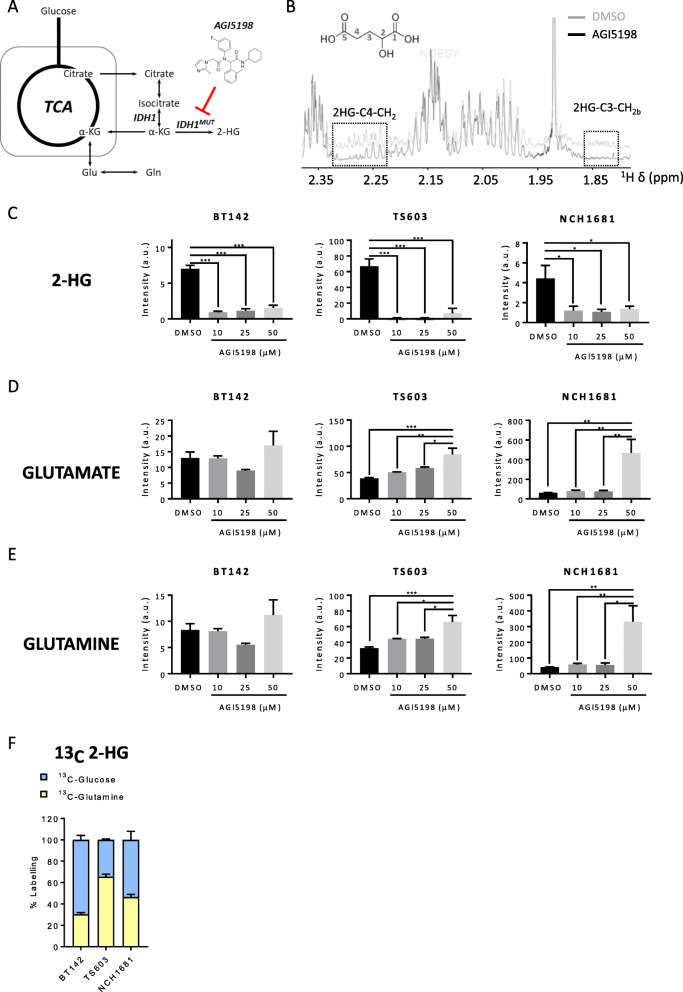
a Simplified representation of the TCA cycle and its link with IDH1 enzyme and glutamine. b 1H NMR representative spectrum of an IDH1mut glioma cell line after 10 μM AGI5198 treatment for 72 h (black) or DMSO (gray). The 2HG chemical structure is displayed (upper left insert) with carbon atom numbering included. Boxed areas denote regions for the two protons linked to C4 and one to the C3 (Hb) group, since the remaining one (Ha) is overlaid by the larger proline resonance centered at 1.98 ppm. c 2HG, d glutamine, and e glutamate intensities normalized to protein content from polar extracts of IDH1mut cell lines after 10, 25, and 50 μM AGI5198 treatment for 72 h or DMSO obtained by LCMS analysis. Bar plots depicting the normalized intensities from n = 3 samples per experiment. *p < 0.05; **p < 0.005; ***p < 0.001 from a one-way ANOVA followed by Tukey’s HSD test for multiple comparisons. f Contribution of glucose and glutamine to 2HG formation obtained by LCMS analysis from 2 independent experiments involving the aforementioned 13C probes. Bar plots displaying mean ± SD from adjusted percentages (n = 3)

