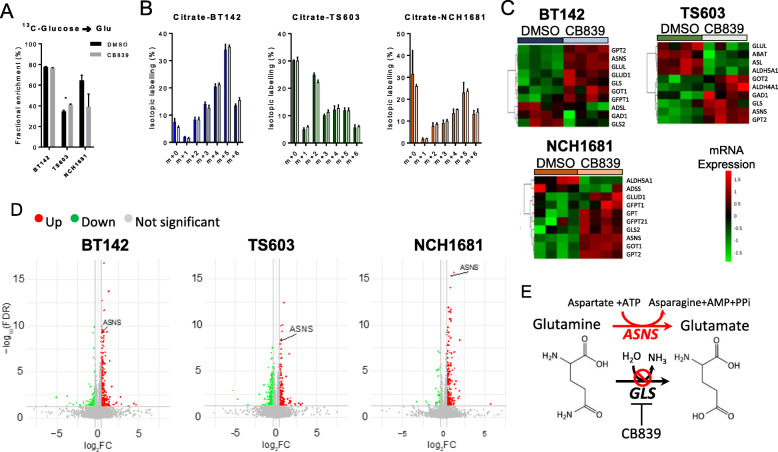
Fig. 4.
a 13C incorporation into Glu from 13C-U-glucose (n = 3, data displayed as mean ± SD; *p < 0.05 from a t test). b Distribution of isotopologues of citrate when cells were grown in media containing 13C-U-glucose (m+0, unlabeled; m+1, m+2, m+3, m+4, m+5, and m+6 represent the degree of m/z increase due to 13C labeling). c Heatmaps displaying the top 10 differentially expressed mRNAs included in the glutamate pathway. d Volcano plots depicting the -Log(FDR p value) vs log2 fold-change (FC) for the mRNA transcripts analyzed. Gray dots refer to those mRNA which have not reached statistical significance (FDR p value < 0.05) nor delivered a Log2FC> 1 or <− 1. Those colored in green are downregulated after treatment, and the red ones are upregulated. e Diagram displaying the correlation between ASNS activity and CB839 metabolic effect

