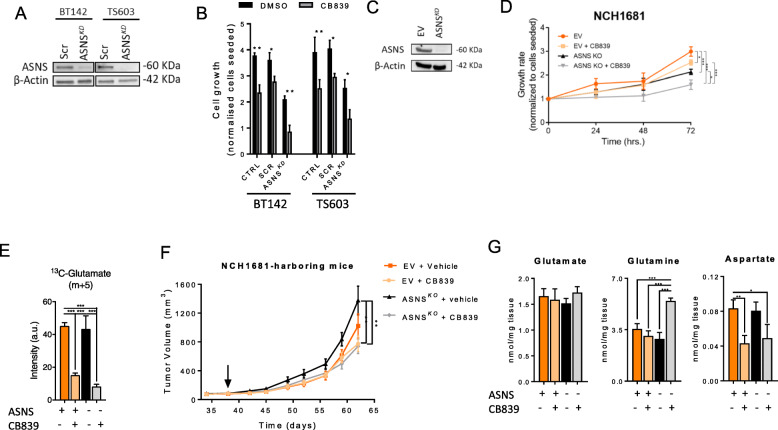
Fig. 5.
a Western blot of ASNS after knocking down the gene. b Growth of BT142 and TS603 for parental cells (CTRL), SCR (siRNA control), and ASNSKD under CB839 or DMSO treatment for 72 h. c Western blot of ASNS in NCH1681-ASNSKO cells. d Growth of NCH1681 and the derived ASNSKO upon CB839 treatment throughout 3 days (for purposes of clarity, only the proliferation differences at 72 h were statistically assessed, n = 3 samples per experiment and time point. *p < 0.05; **p < 0.005; ***p < 0.001 from a one-way ANOVA followed by Tukey’s HSD test for multiple comparisons). e 13C tracing of NCH1681-ASNSKO or empty vector cells upon CB839 treatment incubated in media containing 13C-U-glutamine for 72 h (n = 3, data displayed as mean ± SD; *p < 0.05; **p < 0.005; ***p < 0.001 from a one-way ANOVA followed by Tukey’s HSD test for multiple comparisons). f Tumor volume of the mouse models generated after injection in the flank of the cell lines displayed in c. The arrow points at the starting treatment time. (n = 8–12, for each time point and class), data displayed as mean ± SEM (*p < 0.05; **p < 0.005 from a two-way ANOVA by Tukey’s HSD test for multiple comparisons). g Glutamate, glutamine, and aspartate levels for the tumor tissue collected from the mouse models after 27 days of CB839-treatment or vehicle (n = 3, data displayed as mean ± SD; *p < 0.05; **p < 0.005; ***p < 0.001 from a one-way ANOVA followed by Tukey’s HSD test for multiple comparisons)

