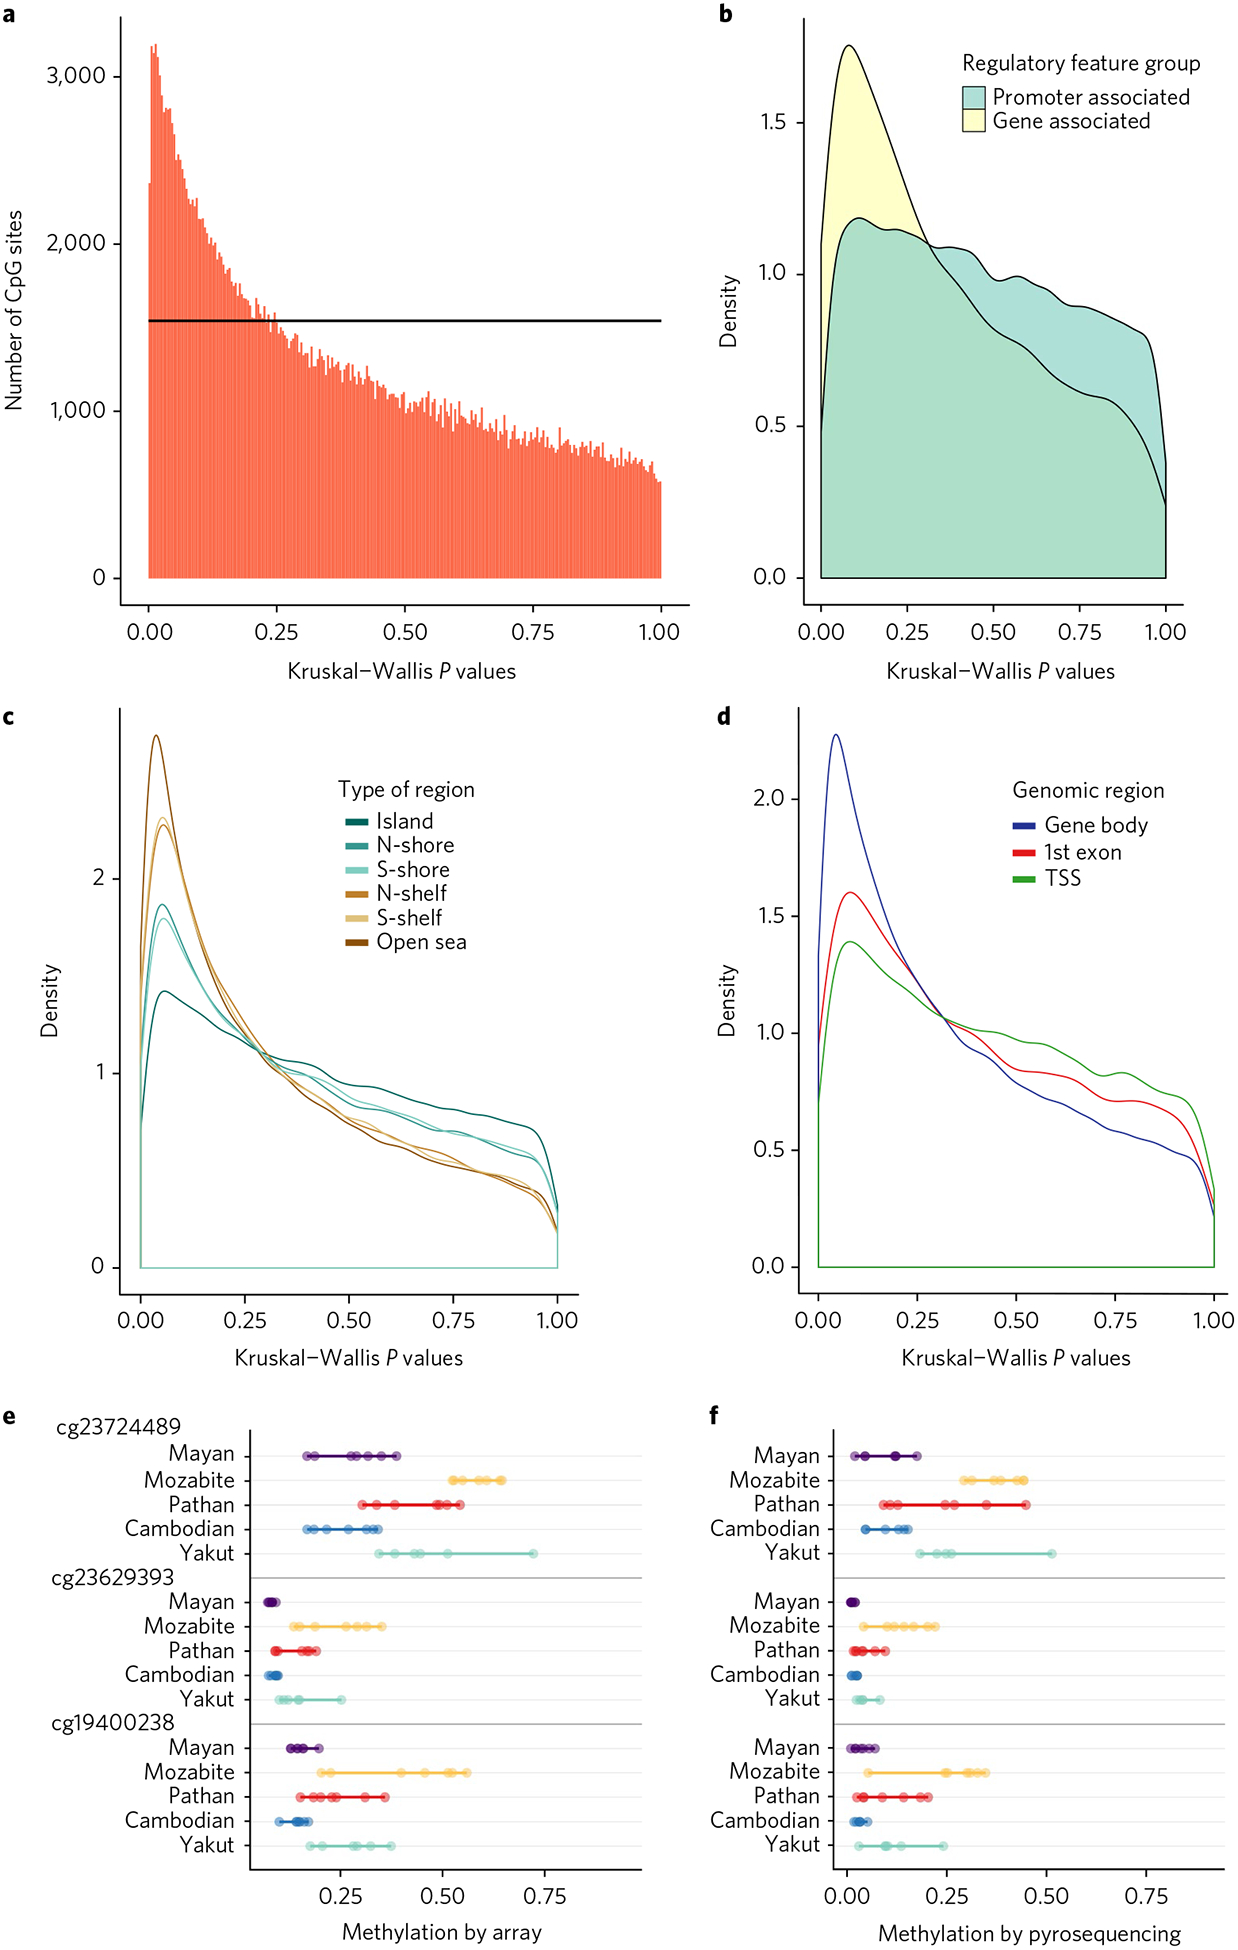
Fig. 2 |. Population specificity of Cpg methylation.

a, A graph of Kruskal–Wallis P values for all CpG sites across all individuals in the five different populations. The black horizontal line corresponds to the uniform P value distribution expected by chance. b–d, Differences based on different types of CpG regions. The CpG sites that exhibit population differentiation are enriched in regions that are gene-associated, outside of CpG islands, and inside gene bodies (TSS, transcription start sites). e,f, Comparison of percentage methylation by array (e) and by pyrosequencing (f) for the top three CpG sites with highest population specificity.
