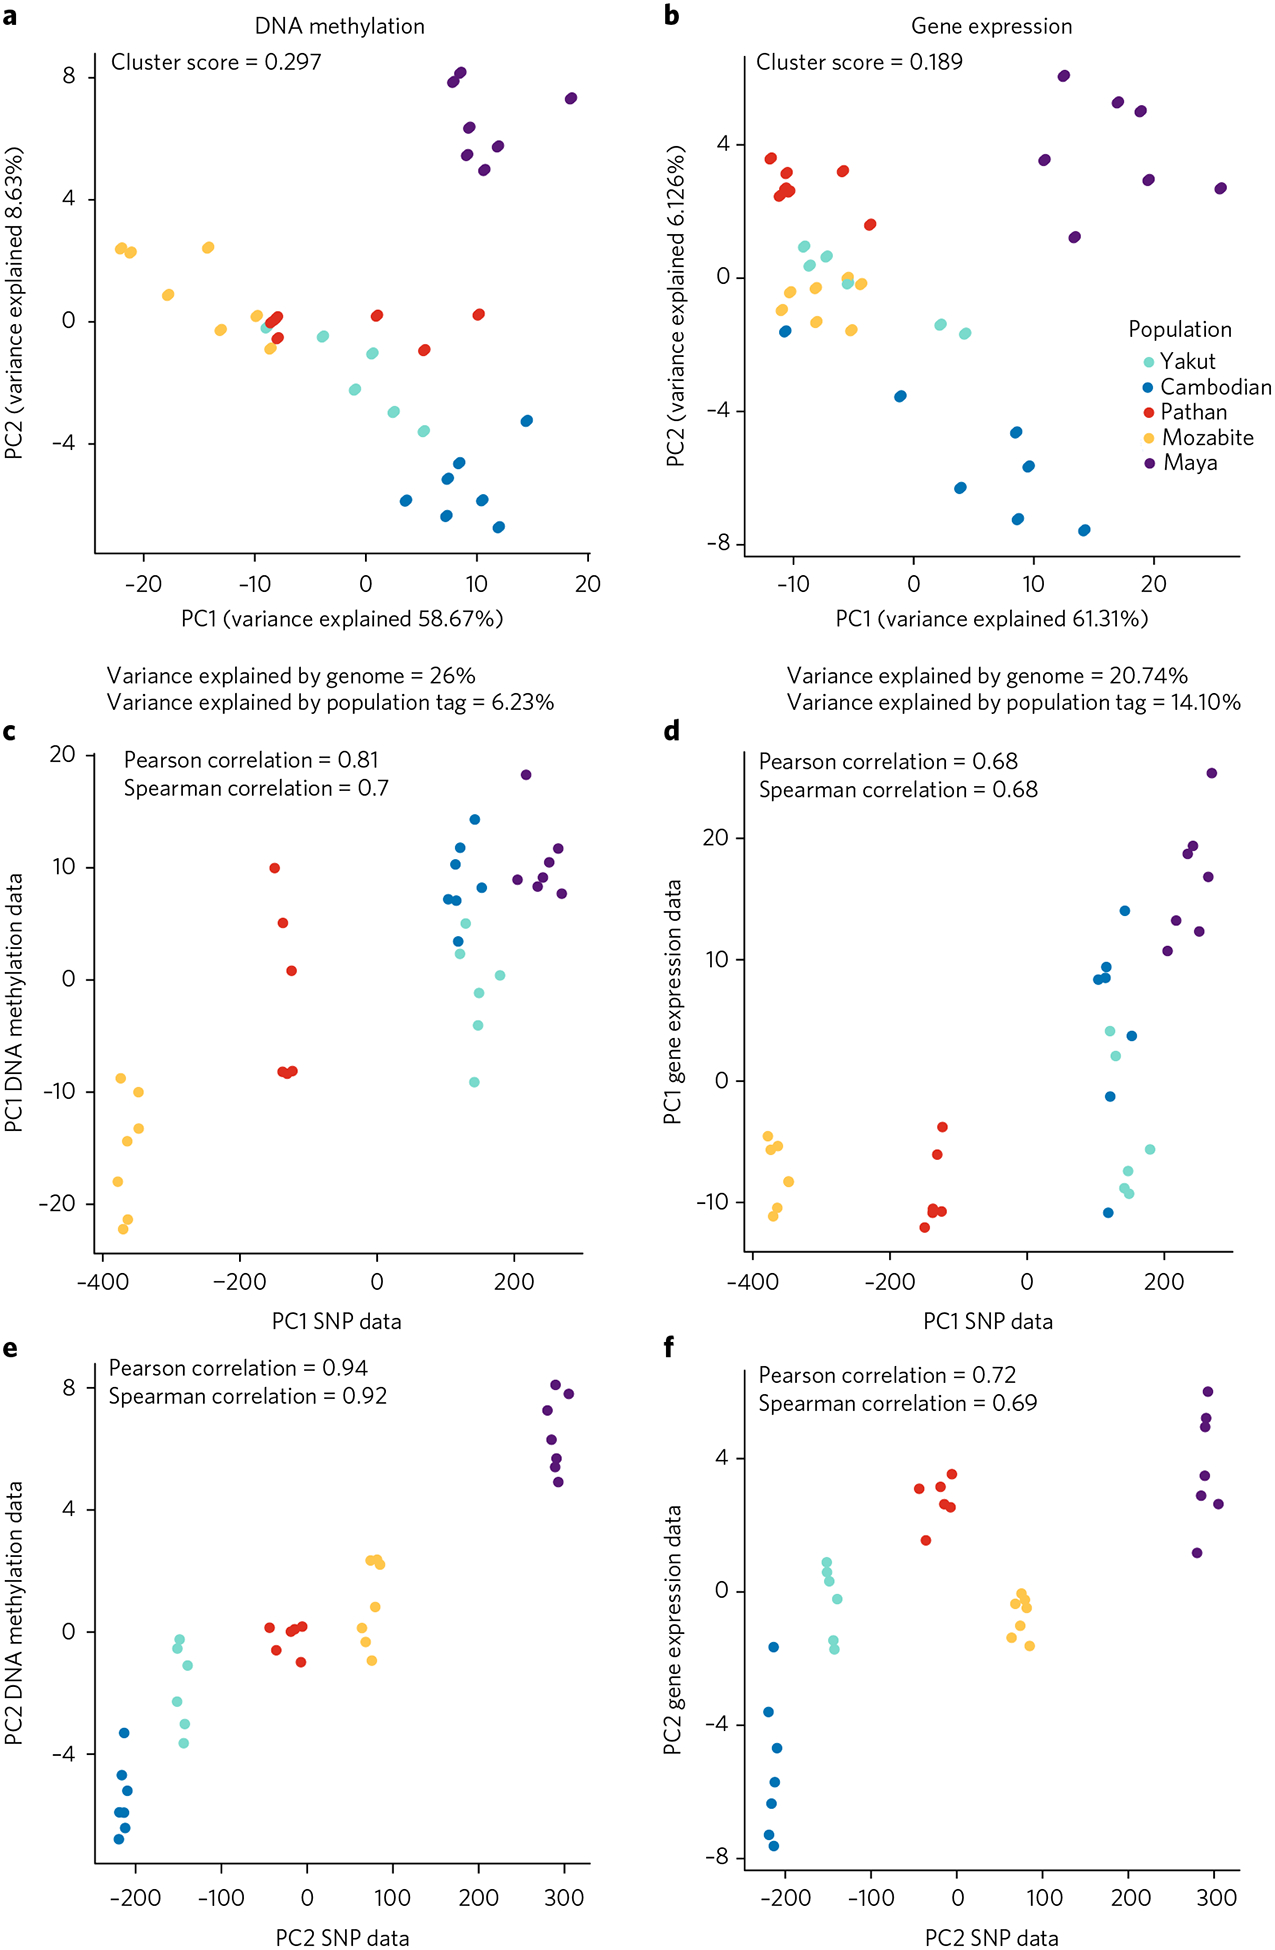
Fig. 3 |. Structure of epigenome-wide population differences.

a, PCA using top 200 CpG sites with highest Pst values. b, PCA using top 200 gene expression levels with highest Pst values. Silhouette cluster scores (SCS) and percentage of variance explained by genetic variation versus the population label are as presented. c–f, Scatter plots of PC1 and PC2 SNP genotype data versus DNA methylation data (c,e) and gene expression data (d,f).
