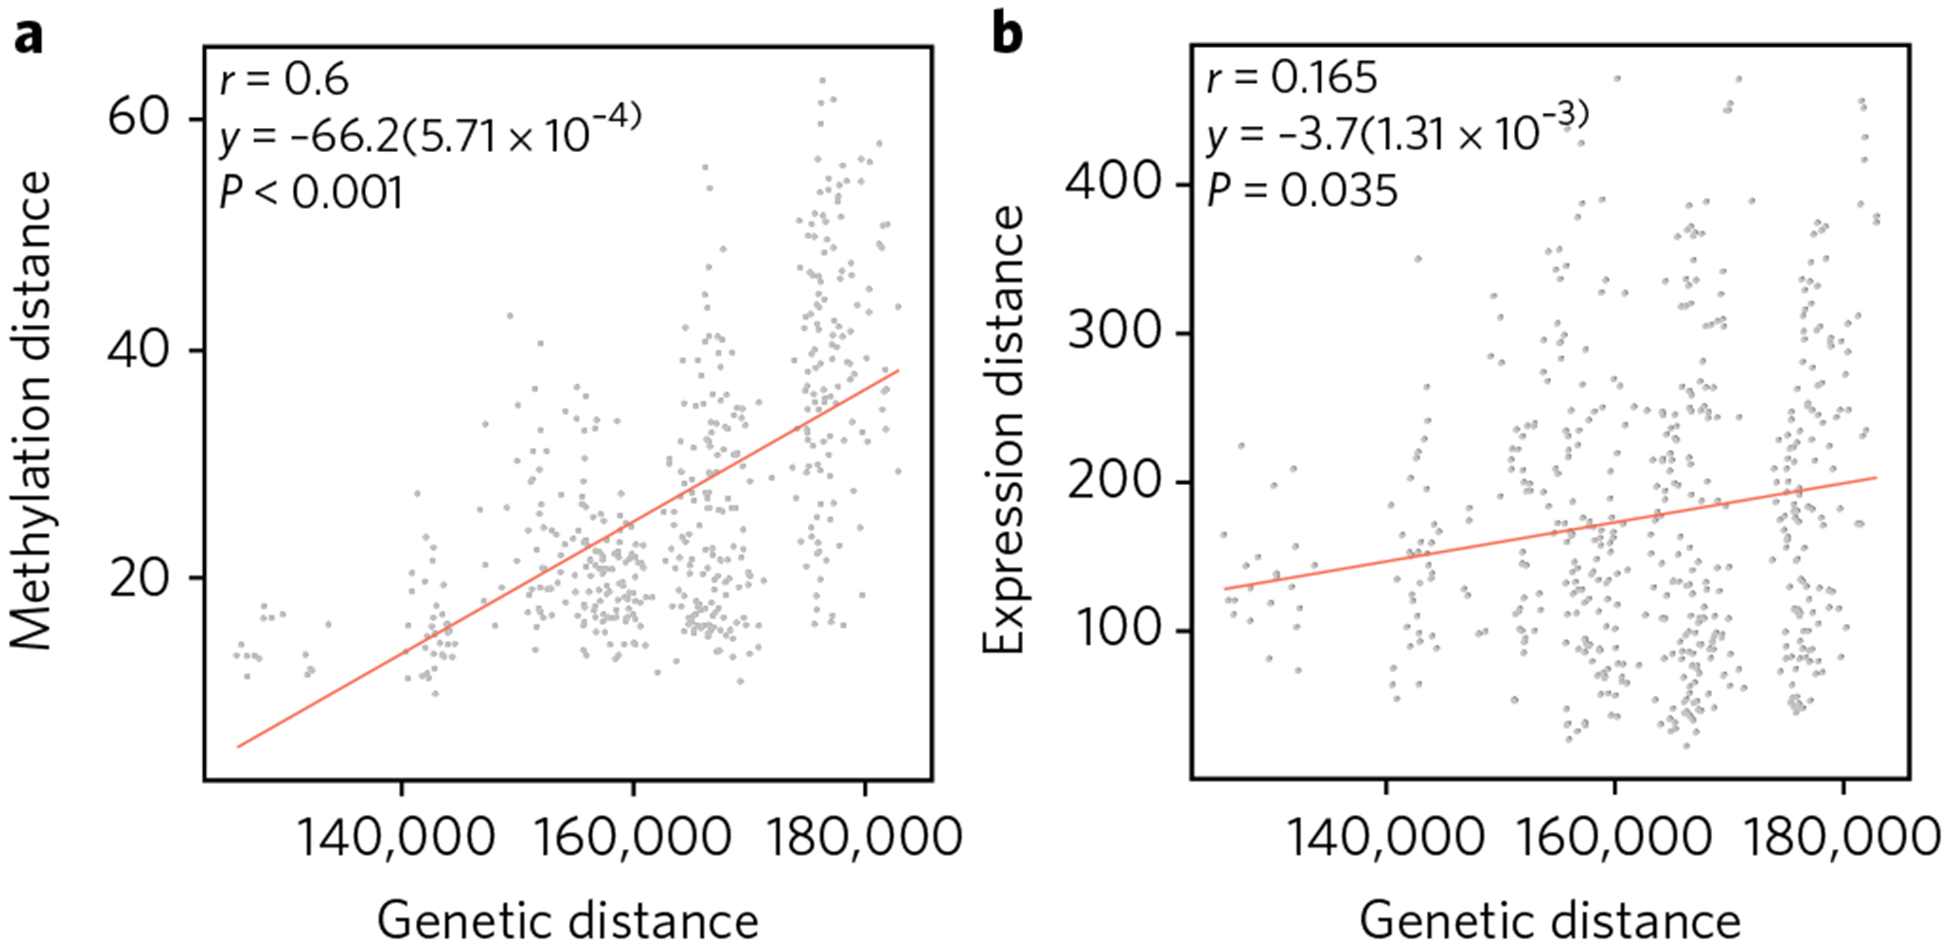
Fig. 4 |. epigenetic divergence as a linear function of genetic distance.

a,b, The x axis represents sequence divergence, measured as number of allele differences. The y axes are the genome-wide CpG methylation Manhattan distance (a; using the CpG sites with top 200 Pst values, between every pair of individuals across the five populations) and the genome-wide mRNA Manhattan distance (b; using the expression levels with top 200 Pst values, between every pair of individuals across the five populations). The linear regression lines are shown, together with the correlation coefficients and permutation P values using 1,000 randomizations of the data.
