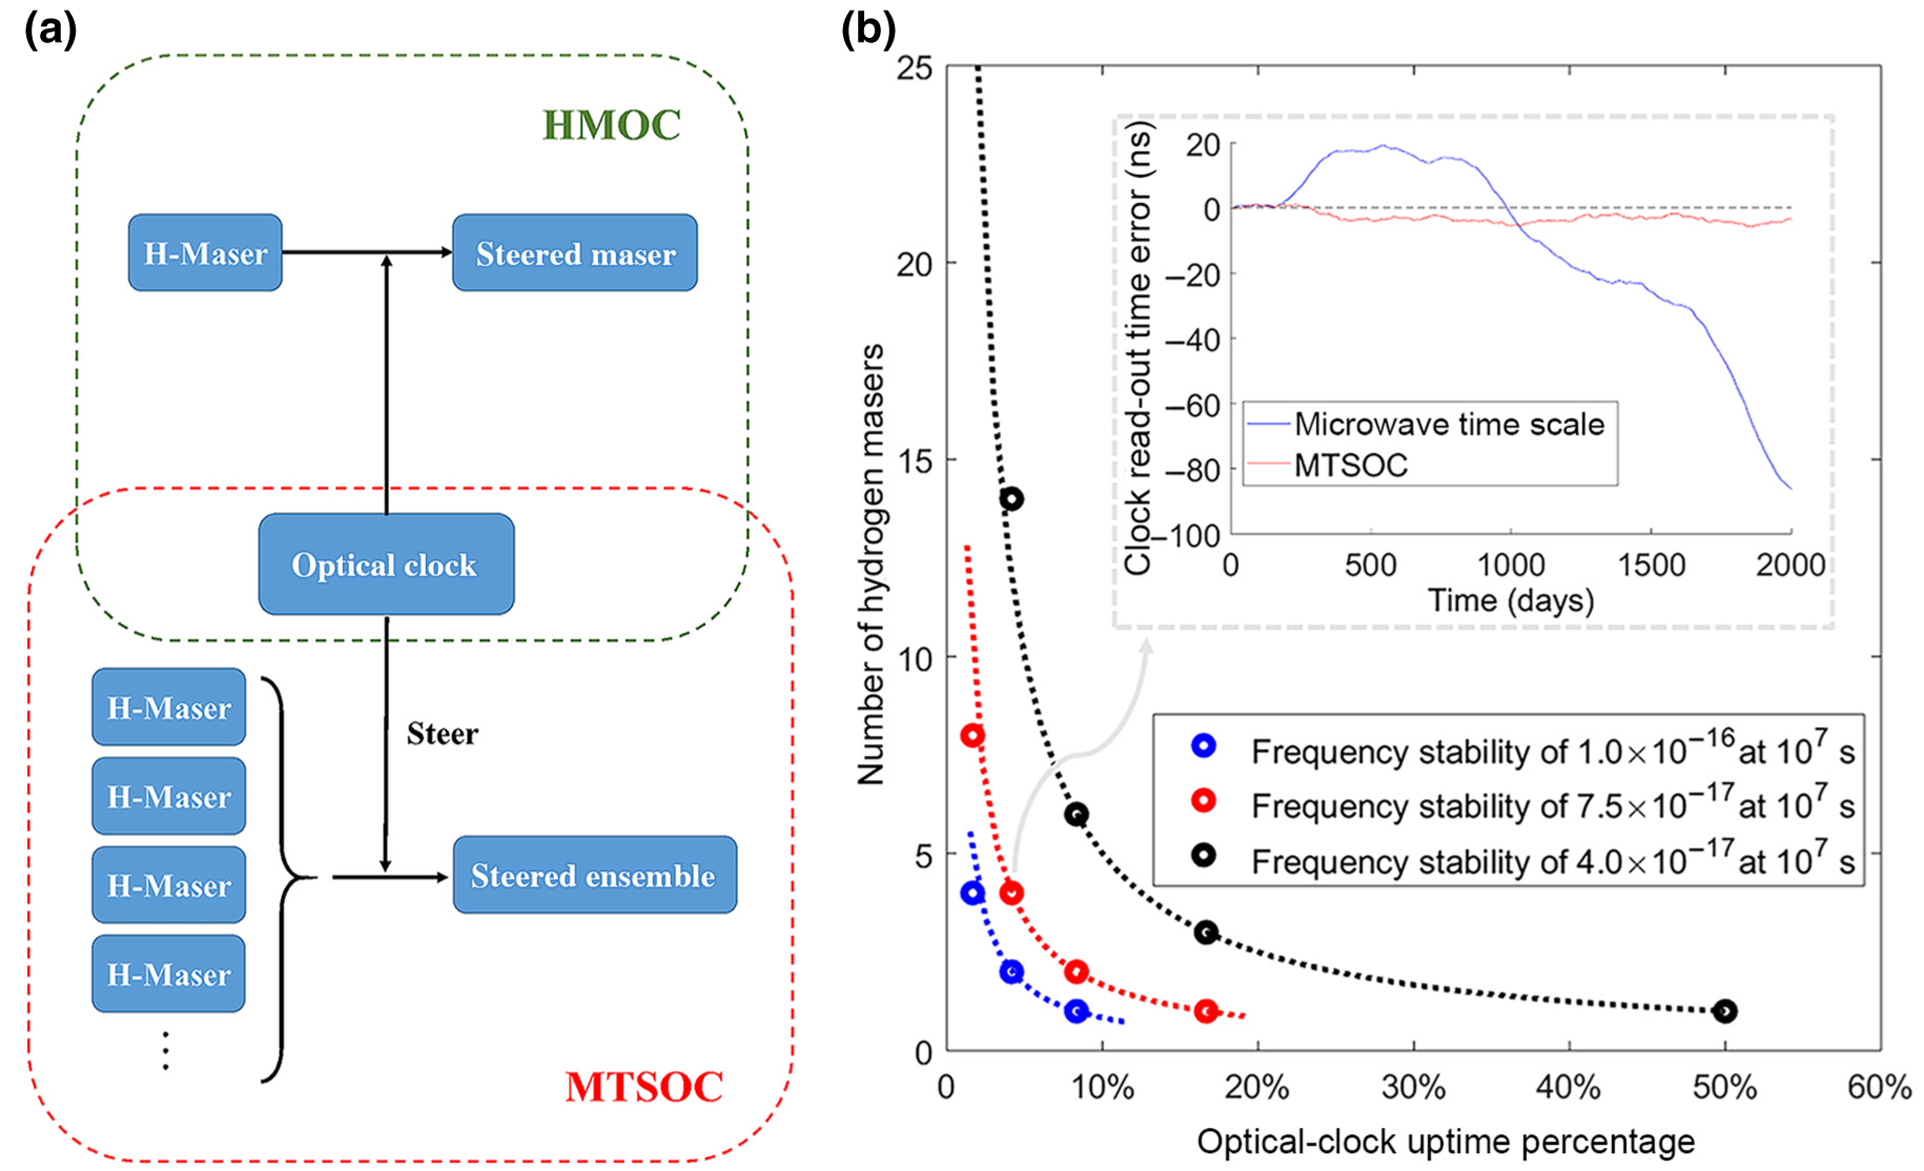
FIG. 1.

Concept of an optical-clock-based time scale. (a) Illustrates the HMOC architecture (green dashed box) and the MTSOC architecture (red dashed box). (b) Summarizes the relation between the number of masers and the optical-clock uptime for different performance goals (blue, 1.0 × 10⁻¹⁶ at 107 s; red, 7.5 × 10⁻¹⁷ at 107 s; black, 4.0 × 10⁻¹⁷ at 107 s), when an optical clock runs once a day. The dots are the results of simulations, and the dashed curves are hyperbolas, which well fit the dots. The inserted plot of (b) shows an example of the simulation in time series. The blue solid curve is the read-out time error of a microwave time scale composed of four hydrogen masers, and the red solid curve is the read-out time error of a MTSOC composed of the four hydrogen masers and an optical clock of 4.2% uptime. Note (b) is plotted based on the simulations in [24].
