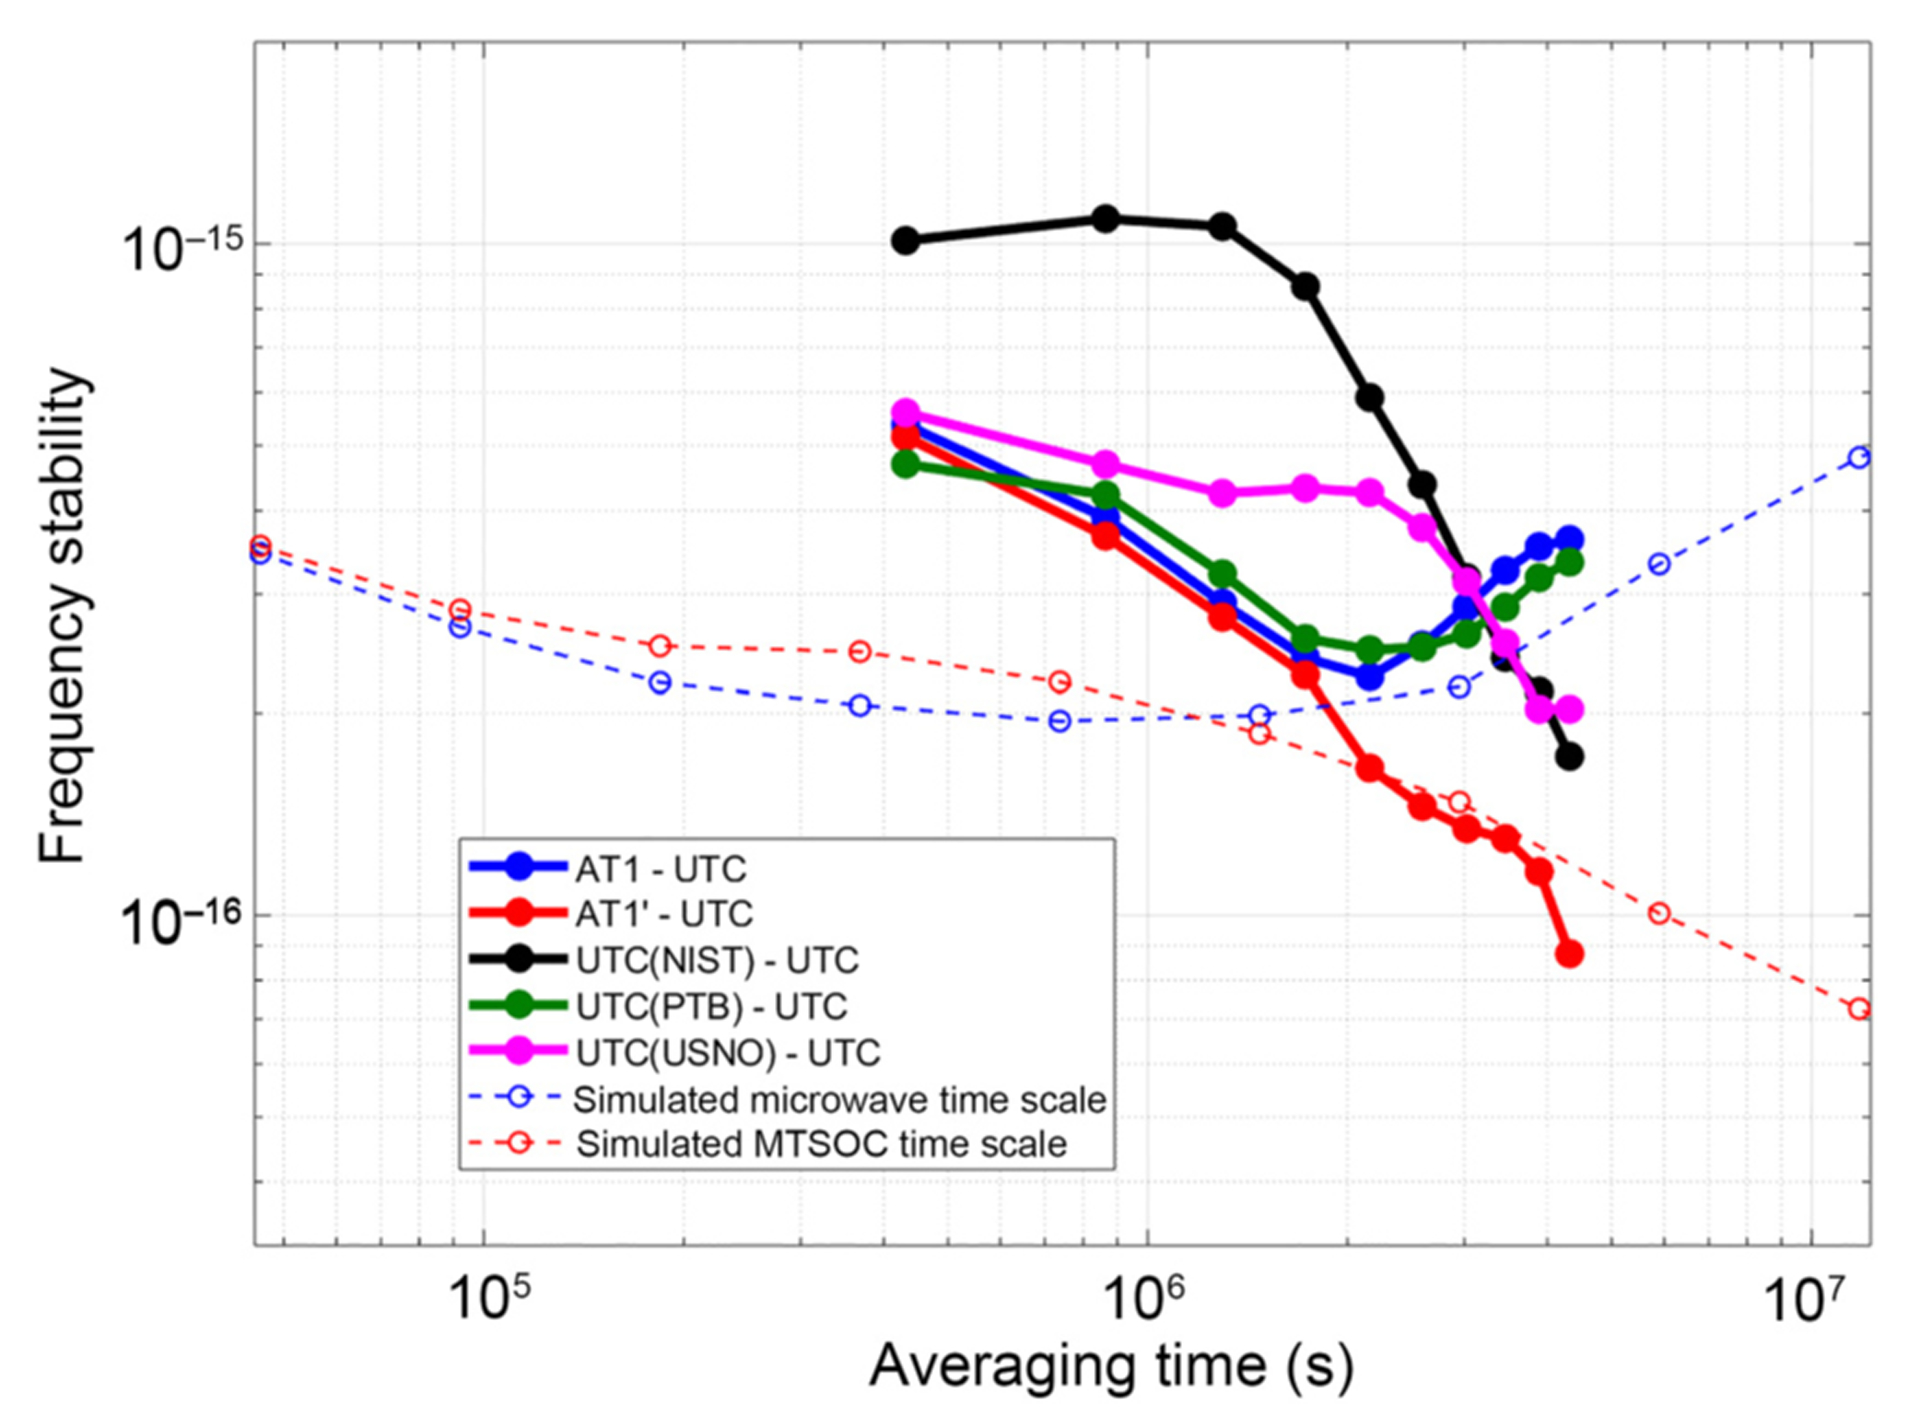
FIG. 4.

Frequency stability of AT1, AT1′, UTC(NIST), UTC(PTB), and UTC(USNO), for MJD 58054–58214. The frequency stability is characterized by modified total deviation, and error bars (omitted here for plot clarity) are provided in Appendix C. The dashed curves show the simulation result. Note, the simulated MTSOC time scale (red dashed curve) is composed of the simulated microwave time scale (blue dashed curve) and a simulated optical clock that runs one hour per day.
