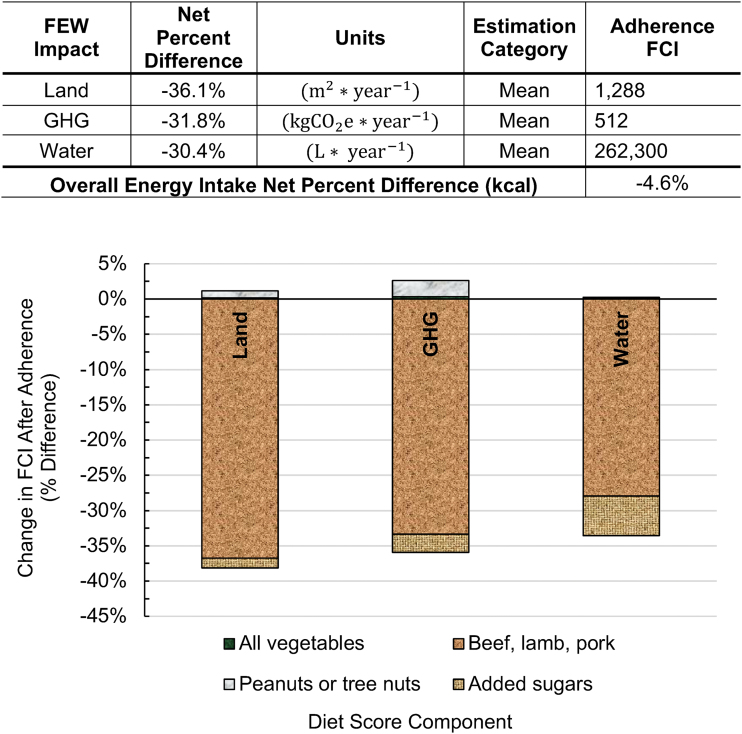
FIG. 2.
Per capita adherence FCIs for U.S. This figure contains details for the net reduction of FCIs in the scenario that all diet score criteria are satisfied compared with baseline conditions: that is, a diet score of 12/12. The numerals in the top portion of this figure show the net change in FCIs and overall energy intake (kcal: kilocalories) as a percentage. Adherence FCIs are also shown as quantitative rates where the land and water FCIs are rounded up based on four significant digits, while the GHG FCI is rounded up based on three significant digits. The stacked and textured bar graph content in the bottom portion of this figure details the percentage change of each diet score component. Furthermore, the bar graph content is proportional, where bars that extend above the x-axis (0%) represent a categorical addition to FCIs and those that fall below represent a categorical reduction in FCIs. Diet score components that meet criterion in the baseline—as shown in Figure 1—are omitted from this figure since they yield 0% change. FCI, food consumption impact; GHG, greenhouse gas. Color images are available online.

