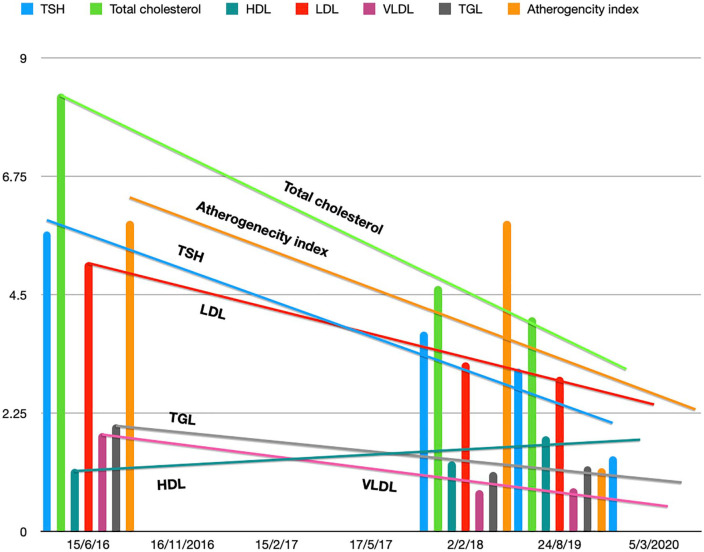
Figure 3.
Trend of lipid parameters and Thyroid Stimulating Hormone (TSH).
Trend of lipid parameters and TSH.
Total cholesterol: Reduced from 8.32 to 4.07 mmol/l (N: 3.10-5.16 mmol/l).
High Density Lipids (HDL): Increased from 1.19 to 1.81 mmol/l (N: 1.0-2.07 mmol/l).
Low Density Lipids (LDL): Reduced from 5.12 to 2.94 mmol/l (N: 1.71-3.40 mmol/l).
Very Low Density Lipids (VLDL): Reduced from1.87 to 0.82 mmol/l (N: 0.26-1.04 mmol/l).
Triglycerides: Reduced from 2.04 to 1.24 mmol/l (N: 0.45-1.60 mmol/l).
Atherogenicity index: Reduced from 5.9 to 1.2 (N: 1.5-3).
TSH: Reduced from 5.7 to 1.43 µIU/ml (N: 0.4–4 µIU/ml).

