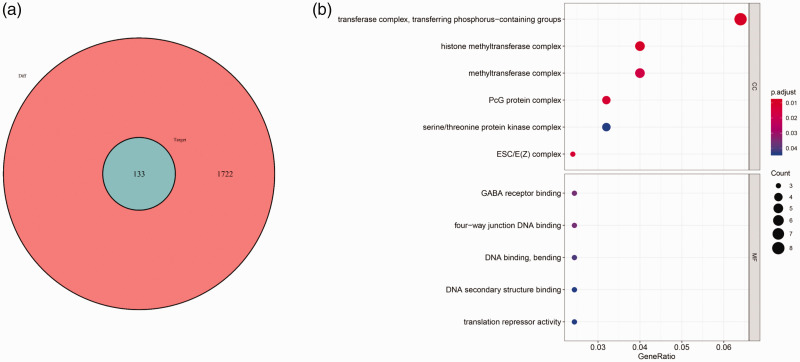
Figure 4.
Mutual mRNAs between differentially expressed and predicted mRNAs, and their GO analysis. (a) Venn diagram of differentially expressed mRNAs and predicted mRNAs. Red circle shows the 1722 dysregulated mRNAs; blue circle shows the 134 target mRNAs of dysregulated lncRNAs. (b) GO enrichment analysis of mRNAs involved in the competing endogenous RNA network.
GO, Gene ontology.

