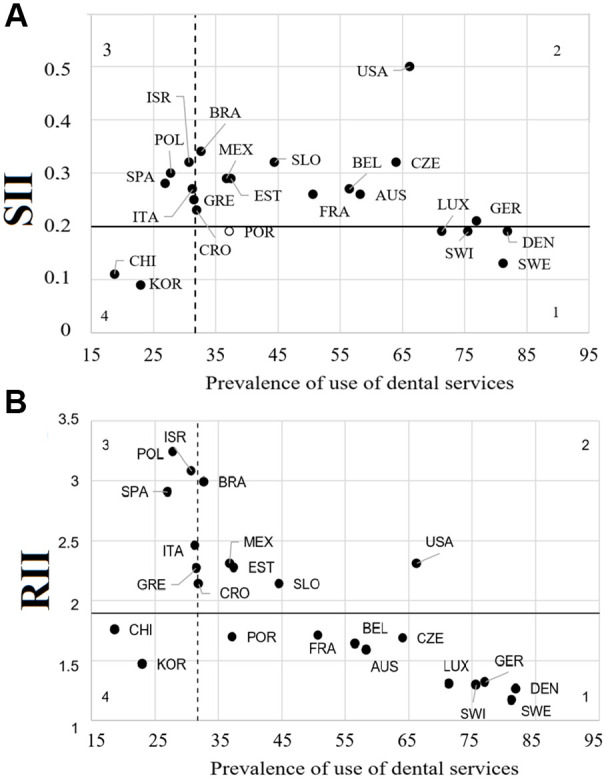
Figure 2.

Distribution of countries by inequalities indices and the prevalence of dental service use. (A) Adjusted slope index of inequality (SII) compared to the prevalence of use of dental services and overall SII. (B) Adjusted relative index of inequality (RII) compared to the prevalence of use of dental services and overall RII. Dashed line = prevalence of recent dental visit in the pooled sample; black line = overall inequality index for the pooled sample; empty marker = country’s index is not statistically significant. Quadrant 1 = high prevalence of recent dental visit and low inequality; quadrant 2 = high prevalence of recent dental visit and high inequality; quadrant 3 = low prevalence of recent dental visit and high inequality; quadrant 4 = low prevalence of recent dental visit and low inequality.
