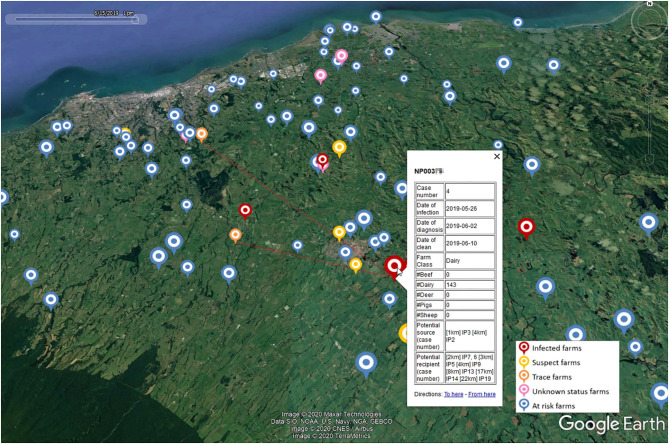
Figure 5.
A snapshot of a network map for a hypothetical foot-and-mouth disease (FMD) outbreak on a particular date (15 June 2019) generated by the Standard Analysis of Disease Investigation (SADI). The icons represent farms, with icon colours representing farm status and icon size representing the number of animals present. Selection of a particular farm of interest (NP003xx) displays the details of this farm including all temporally plausible infection source and recipient farms by distance, and traced movements from or to this farm.

