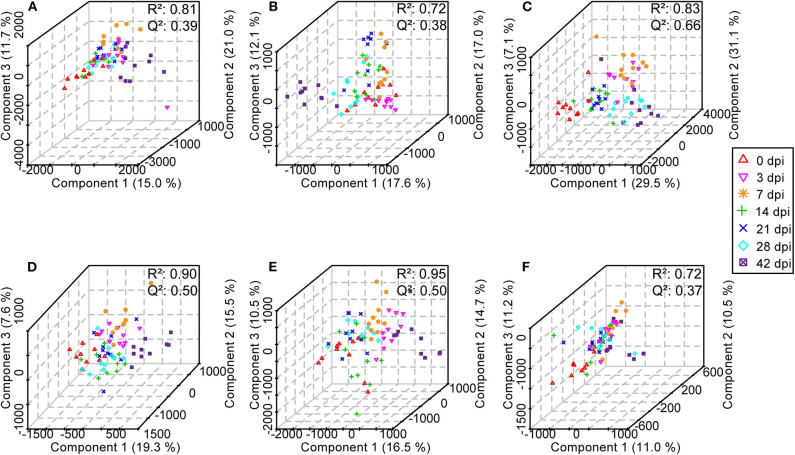
Figure 8.
Three-dimensional score plots of partial least squares-discriminatory analysis from healthy mice and infected mice at different time points. Each point represents an individual. (A) Serum samples in positive electrospray ionization (ESI+) mode. (B) Urine samples in ESI+ mode. (C) Liver aqueous extracts in negative electrospray ionization (ESI-) mode. (D) Serum samples in ESI- mode. (E) Urine samples in ESI- mode. (F) Colon aqueous extracts in ESI- mode.

