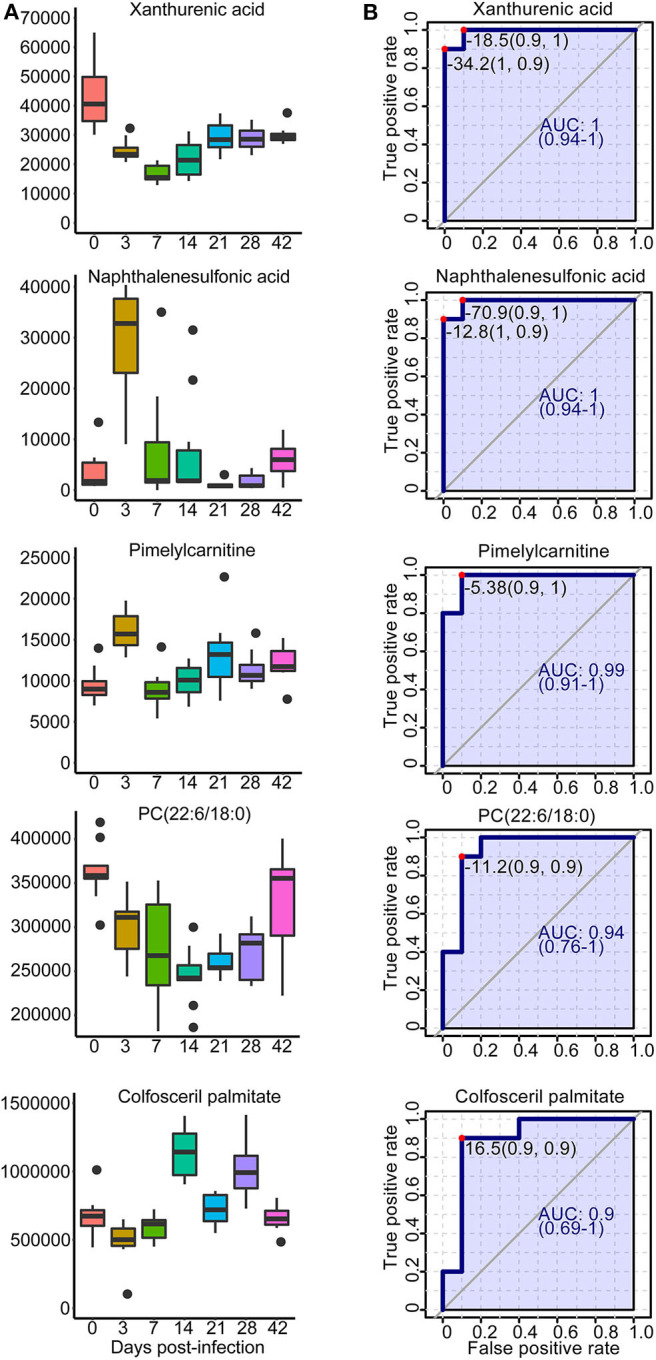
Figure 9.

Overview of selected representative metabolites from serum and urine associated with schistosomiasis. (A) Box plots showing the abundance of selected biomarkers. Each column represents a time point. (B) The receiver operating characteristic curve for selected biomarkers. The x-axis represents the specificity, while the y-axis represents the sensitivity.
