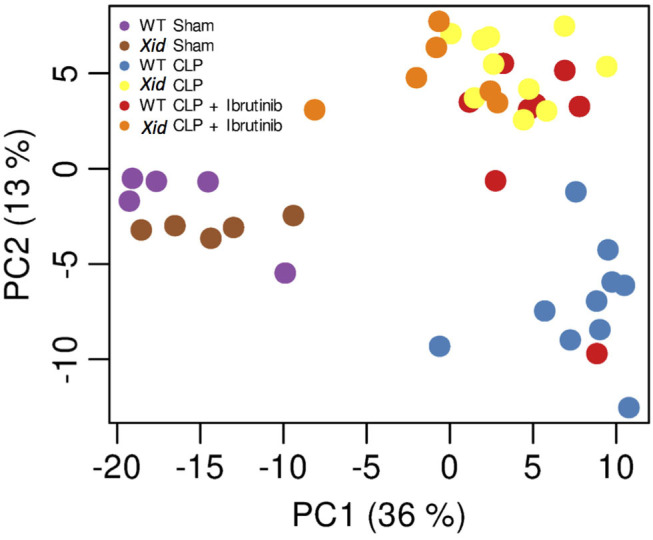
Figure 6.

Principal component analysis (PCA). Principal component analysis (PCA) of the normalized and scaled metabolome data. Plot shows first two principal components (PC), which account for almost half of the total variance in the data set. Variance between replicates is far less than between different experimental conditions. Contrasts between main experimental conditions are visible in the shown PCs. Each dot represents a sample and each color represents a mice group.
