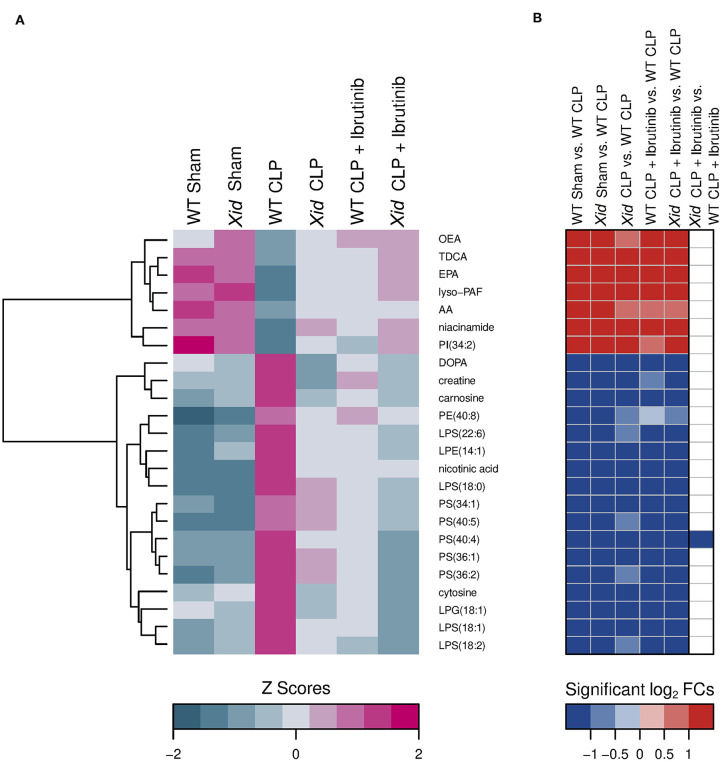
Figure 7.
Heatmap of significant restored metabolites in the groups XID CLP, WT CLP + Ibrutinib, and XID CLP + Ibrutinib. (A) Hierarchical clustered z score heatmaps showed significantly changed analytes and (B) log2-fold change heatmaps showed their significant log2-fold changes for selected groupwise comparisons. The heatmap shows analytes which, compared to the WT CLP group (n = 10), restored in all three groups [Xid-CLP (n = 10), WT-CLP + ibrutinib (n = 8), and Xid-CLP + ibrutinib (n = 6)] to the level of the two sham groups [WT Sham (n = 5), Xid Sham (n = 5)]. Each column in a z score heatmap represented the mean value of all animals in a group, each column in a log2-fold change heatmap represented a groupwise comparison and each row defined an analyte. Analytes were hierarchically clustered using Ward's minimum variance method (76) and an euclidian distance between log2-fold changes. Dendrograms provide information about distances between clusters. AA, arachidonic acid; AEA, arachidonoylethanolamide; DHA, docosahexaenoic acid; DOPA, dihydroxyphenylalanine; EPA, eicosapentaenoic acid; LPE, lysophosphatidylethanolamine; LPG, lysophosphatidylglycerol; LPS, lysophosphatidylserine; lyso-PAF, lyso-platelet activating factor; OEA, oleoylethanolamine; PE, phosphatidylethanolamine; PI, phosphatidylinositol; PS, phosphatidylserine; TDCA, taurodeoxycholic acid.

