
FIGURE 2.
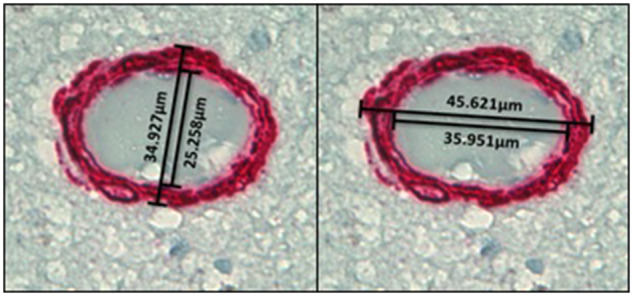
Illustrative images of Sclerosis Index (SI) measurement at 60× magnification. The final SI value per vessel is the average of the SI of the widest and narrowest axes of the arteriole.
Official websites use .gov
A
.gov website belongs to an official
government organization in the United States.
Secure .gov websites use HTTPS
A lock (
) or https:// means you've safely
connected to the .gov website. Share sensitive
information only on official, secure websites.
Illustrative images of Sclerosis Index (SI) measurement at 60× magnification. The final SI value per vessel is the average of the SI of the widest and narrowest axes of the arteriole.