Figure 3.
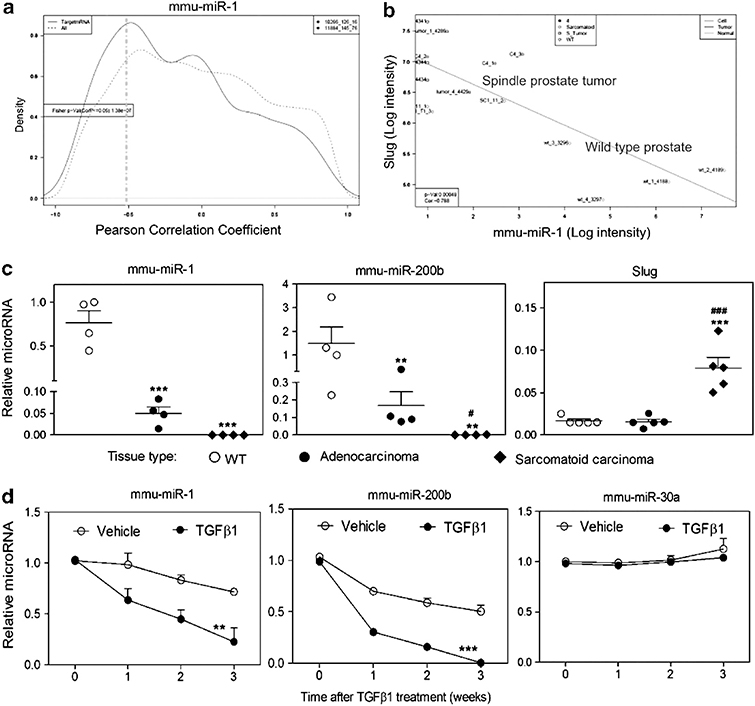
TGFβ induces decreased levels of miR-1 and miR-200b expression. (a) Analysis of inverse relationship between transcript level of mmu-miR-1 and its putative mRNA targets. The curves shown represent the global distribution of Pearson correlation coefficients between mRNAs and mmu-miR-1. The dashed line shows the distribution of the correlation coefficients for all mRNAs, whereas the solid line shows the correlation coefficient distribution for only those mRNAs that are predicted targets of mmu-miR-1. The solid line has an additional shoulder towards the left side indicating an enrichment of target mRNAs, whose transcript levels are negatively correlated with the transcript levels of mmu-miR-1. (b) Negative correlation of Slug and mmu-miR-1 expression levels. mRNA and miRNA levels in normal prostate and Pb-Cre, Ptenfl/flTp53fl/fl-derived primary sarcomatoid carcinomas and cell lines were analyzed using Affymetrix GeneChip Mouse Genome 430 2.0 microarrays and Agilent mouse miRNA microarrays. Matched individual samples from normal prostate (wild type (WT)) (n=4) and Pb-Cre, Ptenfl/flTp53fl/fl-derived primary sarcomatoid carcinomas (n=5) or prostate spindle tumor cell lines, C4 (n=3) and SC1 (n=3), are plotted. The WT samples are in the lower right and the sarcomatoid samples are in the upper left. R=−0.788, P ⩽0.00048. (c) qPCR of mmu-miR-1, mmu-miR-200b and Slug levels determined for normal prostates (WT), adenocarcinomas and sarcomatoid carcinomas. Each symbol represents an individual animal. Data represent means±s.e.m., n=4. *: vs WT, #: vs adenocarcinomas. *P<0.05, **P<0.01 and ***P<0.001. (d) Time course after 2 ng/ml TGFβ1 treatment of qPCR-determined levels of mmu-miR-1, mmu-miR-200b and mmu-miR-30a in AC3E+ cells. Data represent means±s.e.m., n=3. *: vs vehicle. **P<0.01 and ***P<0.001.

