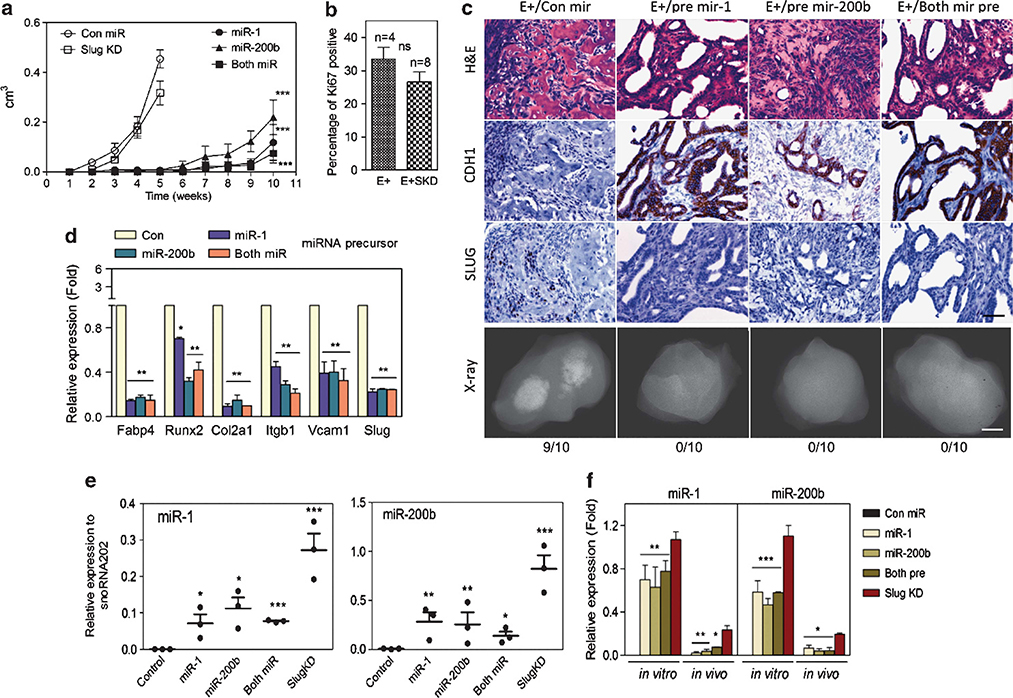
Figure 8.
MiR-1 or miR-200b expression delays tumorigenicity and inhibits in vivo MSC lineage marker expression. (a) Subcutaneous tumor growth as measured by total volume over time in AC3 cells modified as indicated: control miR (con miR) (n=8), Slug-depleted (Slug KD) (n=10) or overexpressing miR-1 (n=10), miR-200b (n=10) or miR-1 + miR-200b (n=10) precursors. *: vs Con miR. **P<0.01 and ***P<0.001. (b) Percentage of Ki-67-positive cells. The percentage of Ki-67-immunolabeled cells was determined in sections from 5-week AC3E+ (n=4) and AC3E+SKD (n=8) tumors by counting until 200 cells were assessed. Quantitative immunostain differences were evaluated with a two-tailed Student’s t-test. NS: no significance. (c) Histological images of subcutaneous tumor sections at 4 weeks from AC3E+ cells with con miR, or at 10 weeks from AC3E+ cells overexpressing miR-1, miR-200b or miR-1 + miR-200b precursors. Hematoxylin and eosin (H&E)-stained sections (upper panels), immunohistochemistry-stained sections (middle panels) for CDH1 and SLUG, and radiographic images of excised tumors (bottom panels) are shown. The numbers of tumors with bone components are indicated. Black scale bars represent 100 μm and white scale bars represent 0.1 cm. (d) qPCR analysis of mesenchymal differentiation marker expression in AC3E+ cells following miRNA precursor transfection. Data represent means±s.e.m., n=3.*: vs Con miR. **P<0.01 and ***P<0.001. (e) qPCR analysis of the indicated miRs measured in RNA isolated from subcutaneous tumors formed by genetically altered AC3E+ cells as indicated in (a). Data represent means±s.e.m., n=3. *: vs Con miR. *<0.05, **P<0.01 and ***P<0.001. (f) qPCR analysis of the indicated miRs measured in RNA isolated from genetically altered AC3E+ cells as indicated in (d) (in vitro) and the average for subcutaneous tumors as indicated in (e) (in vivo). Data are means±s.e.m., n=3. *miR-1, miR-200b or both pre vs SKD. *P<0.05, **P<0.01 and ***P<0.001.

