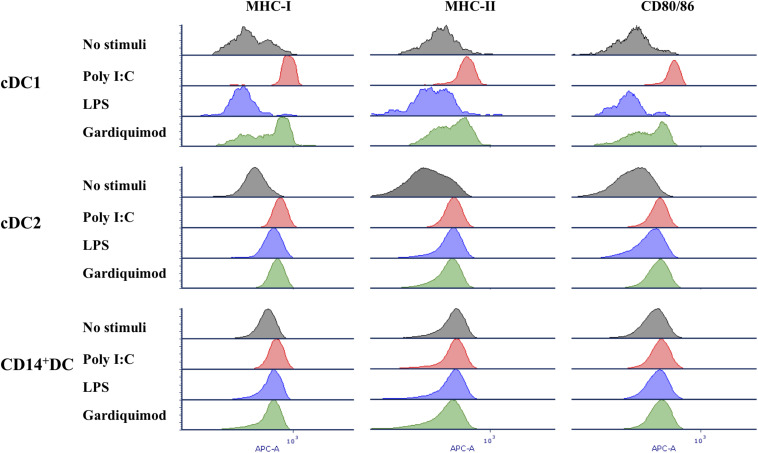
FIGURE 6.
Expression of MHC-I, MHC-II, and CD80/86 on putative cDC1, cDC2, and CD14+ DCs after stimulation by TLR3, TLR4, and TLR7 agonists (10 μg/ml poly I:C, 1 μg/ml LPS, and 10 μg/ml gardiquimod, respectively) for 18 h or unstimulated as controls. Unstimulated control, gray histogram; poly I:C, red histogram; LPS, blue histogram; gardiquimod, green histogram. Data are representative of three pigs.

