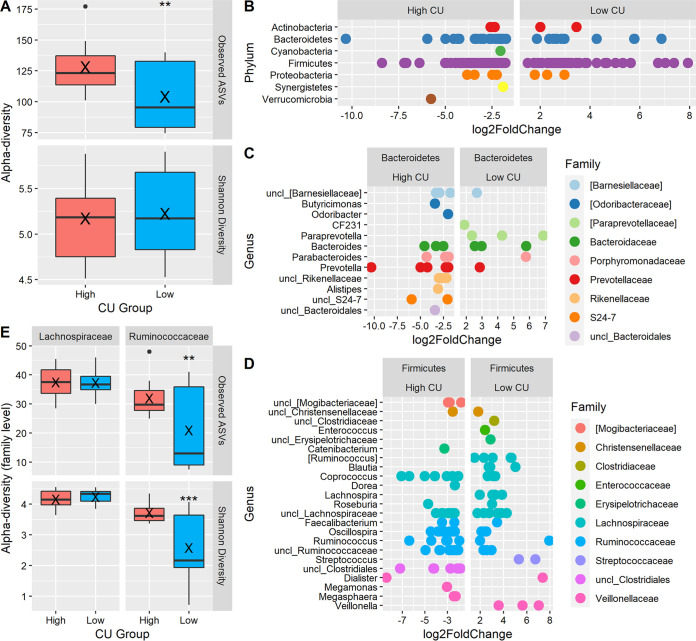
FIG 3.
Comparison of fecal microbiota composition between high- and low-carbohydrate-utilization (CU) groups. (A) α-diversity; (B to D) differentially abundant ASVs by phylum (B) and within the phyla Bacteroidetes (C) and Firmicutes (D); (E) α-diversity of the Lachnospiraceae and Ruminococcaceae families (E). Boil, boiled wheat; extrud, extruded wheat; sour, sourdough bread; unleav, unleavened bread; yeast, yeast-leavened bread. Within box plots, X indicates the mean. **, P < 0.01, and ***, P < 0.001, for high-CU group versus low-CU group.

