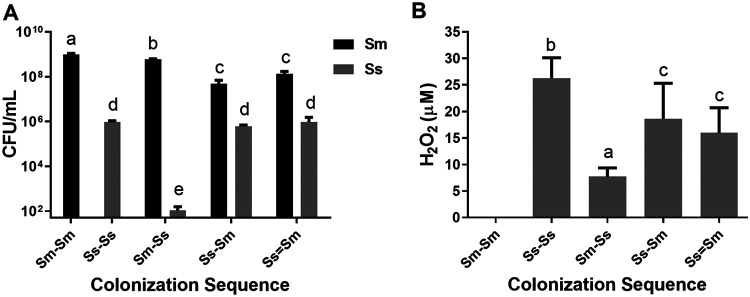
FIG 2.
(A) Viable microorganisms. Mean counts of S. mutans (black bar) and S. sanguinis (gray bar) expressed as CFU per milliliter were determined in each colonization sequence. Bars represent mean values of two independent experiments in triplicate (n = 6). Error bars show the standard deviation. Different letters represent significant differences across all colonization sequences (P < 0.05). These data are adapted from reference 22 with permission of the publisher (Karger Publishers, Basel, Switzerland [copyright 2018]). (B) H2O2 concentration. Production of H2O2 (μM) in each biofilm condition as described in Materials and Methods. Bars show mean values of two independent experiments in triplicate (n = 6). Error bars show the standard deviation. Different letters (a to d) represent significant differences across all colonization sequences (P < 0.05).

