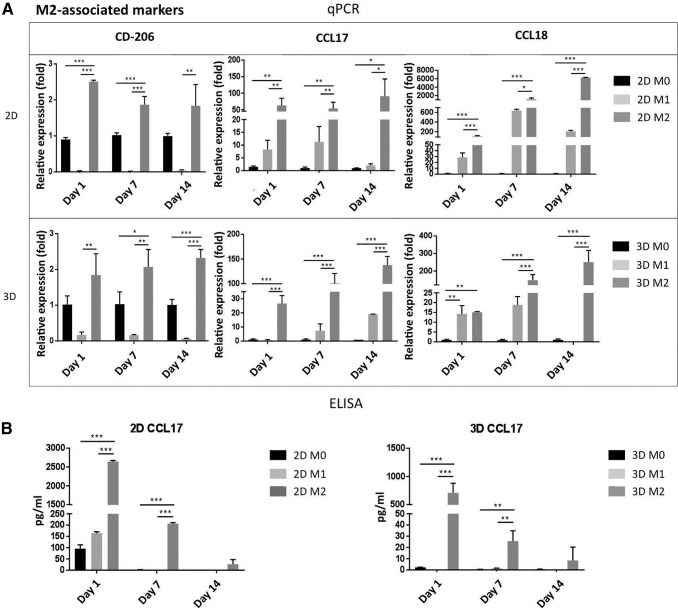
FIG. 4.
Macrophage polarization in 2D and 3D cultures to M2. (A) Expression levels of CD-206, CCL17, and CCL18 genes in M0, M1, and M2 macrophages, respectively, to validate macrophage M2 polarization in 2D (top) and 3D (bottom) cultures at days 1, 7, and 14. (B) CCL17 concentration in the conditioned medium by M0, M1, and M2 at days 1, 7, and 14 under 2D (left) and 3D (right) cultures, which was determined by ELISA. Each value represents the mean ± SD. *p < 0.05, **p < 0.01, and ***p < 0.001, compared with either 2D M0 or 3D M0 cultures. CCL, C–C motif chemokine ligand.

