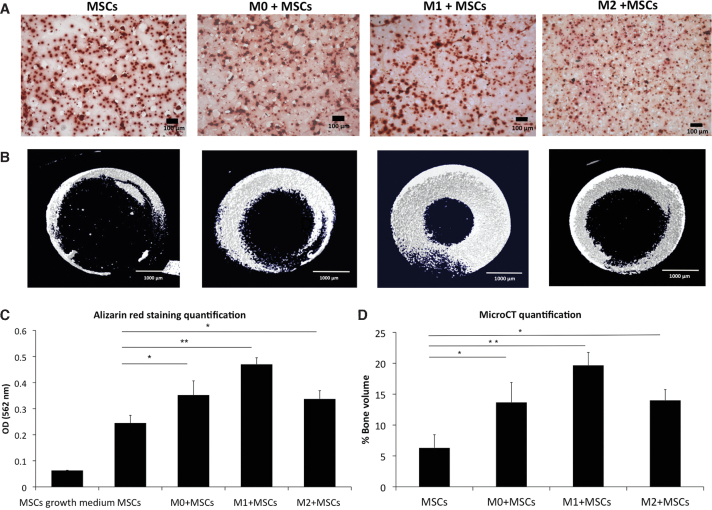
FIG. 6.
hMSC osteogenesis after 4 weeks of 3D co-culture with macrophages. (A) Alizarin Red staining to assess the calcification in the groups that originally contained hMSC only (MSCs) or hMSC co-cultured with M0 (M0 + MSCs), M1 (M1 + MSCs), or M2 (M2 + MSCs). The red dots in the images show the calcium deposits in the extracellular matrix (scale bar = 100 μm). (B) Representative μCT images of extracellular matrix mineralization in hMSCs monoculture and co-cultures of hMSCs with M0, M1, or M2 macrophages (scale bar = 1000 μm). (C) Quantification of Alizarin Red staining of hMSCs in growth medium, MSCs in osteogenic medium and M0, M1 and M2 co-cultures with MSCs in osteogenic medium in 3D scaffolds. (D) μCT quantification of mineralization in hMSC monocultures and hMSCs + macrophages co-cultures. Each value represents the mean ± SD. *p < 0.05, **p < 0.01, compared with hMSC monocultures in osteogenic medium. μCT, microcomputerized tomography. Color images are available online.

