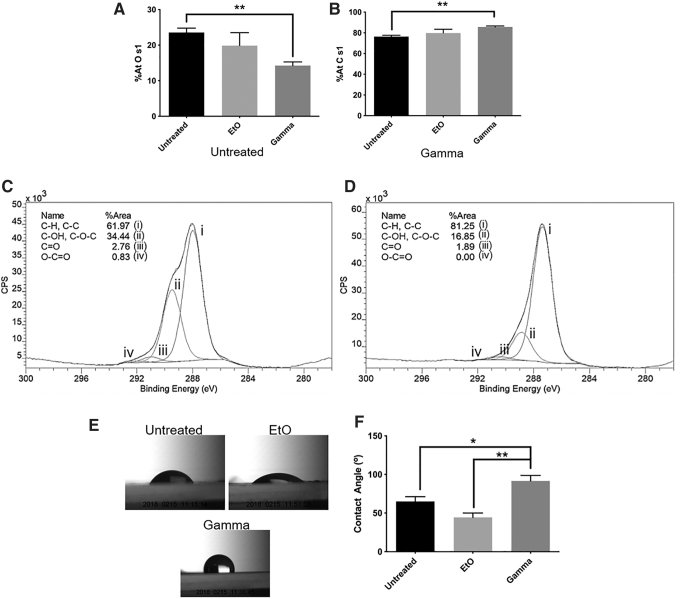
FIG. 5.
Surface atomic concentrations (%At) of (A) oxygen (O s1) and (B) carbon (C s1) on PVA films. (C) C s1 spectra of untreated films and (D) γ-irradiated films showed reduced surface –OH group after γ treatment. (E) Representative images of the water contact angle on PVA surfaces, and (F) average contact angle shown as a bar chart. The data are presented as the average of n = 3 samples ± SE for surface atomic concentration measurements (A, B) and n = 4 samples ± SE for water contact angle measurements (F) (*p ≤ 0.05, **p ≤ 0.01).

