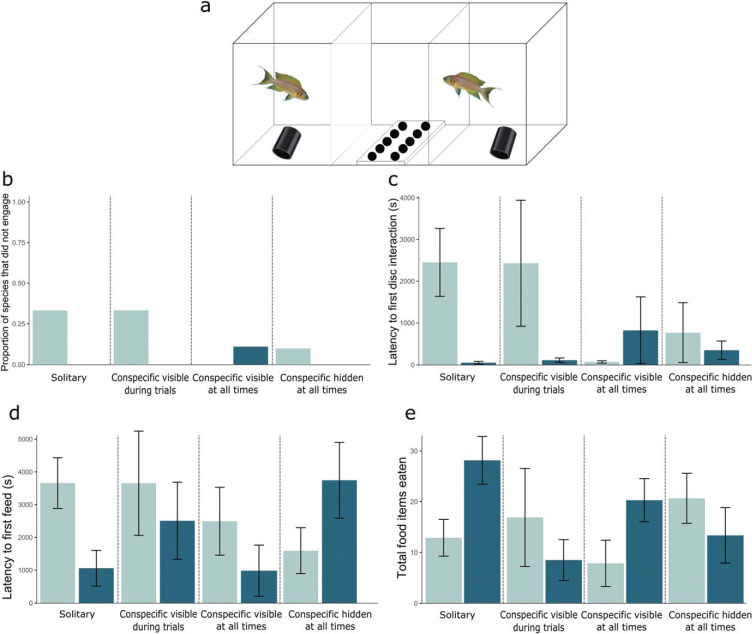
Figure 2.
Experiment 2. Panel a: The aquarium set up for Experiment 2. Panel b: The proportion of fish of each species that never engaged with the test apparatus. Panel c: The mean latency to first disk interaction by each species. Panel d: The mean latency (seconds) of each species to uncover fully hidden food over the four social conditions of solitary, conspecific visible during trials, conspecific always visible, and social control of a conspecific always present but hidden. Panel e: The mean number of food items accessed by each species. Error bars show standard error of the mean. Cooperatively breeding species are in light blue (light gray); noncooperatively breeding species are in dark blue (dark gray).

