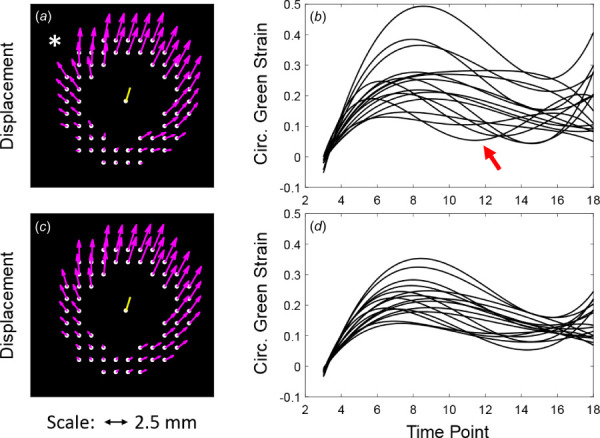
Fig. 4.

Displacement vector map (at peak strain) and plots of circumferential Green strain versus time for all sectors before (a–b) and after (c–d) spatial smoothing of the displacement vectors. Asterisk* notes focal artifact of the displacement field before smoothing that results in an abnormally high circumferential strain. Red arrow notes artifactual increase in circumferential strain before in (b). Both artifacts improve following smoothing with .
