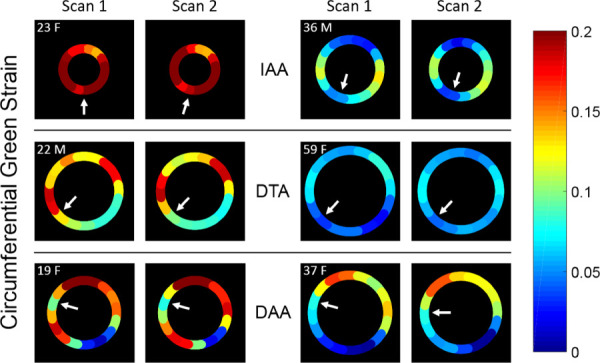
Fig. 6.

Ribbon heatmaps of circumferential Green strain of the aortic wall at the time of peak strain mapped onto the unadjusted reference configuration at for both scans in each volunteer. Small arrows identify Sector 1 for each scan (near the vertebra). (IAA, DTA, and DAA)
