. 2020 Sep 22;142(11):111014. doi: 10.1115/1.4048232

Fig. 8.

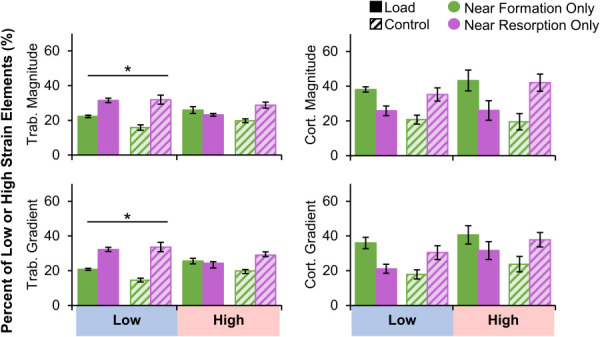
Percent of trabecular (left) and cortical (right) very low and very high strain magnitude (top) and gradient (bottom) elements near formation and resorption for the load (n = 11) and control (n = 10) groups. Data presented as group means (error bars: SEM). *Given significant strain by adaptation interaction, indicates significant difference between formation and resorption within very low strain elements only. Significant group by adaptation interactions were observed for all metrics but are not indicated on plot for visual clarity.

Percent of trabecular (left) and cortical (right) very low and very high strain magnitude (top) and gradient (bottom) elements near formation and resorption for the load (n = 11) and control (n = 10) groups. Data presented as group means (error bars: SEM). *Given significant strain by adaptation interaction, indicates significant difference between formation and resorption within very low strain elements only. Significant group by adaptation interactions were observed for all metrics but are not indicated on plot for visual clarity.