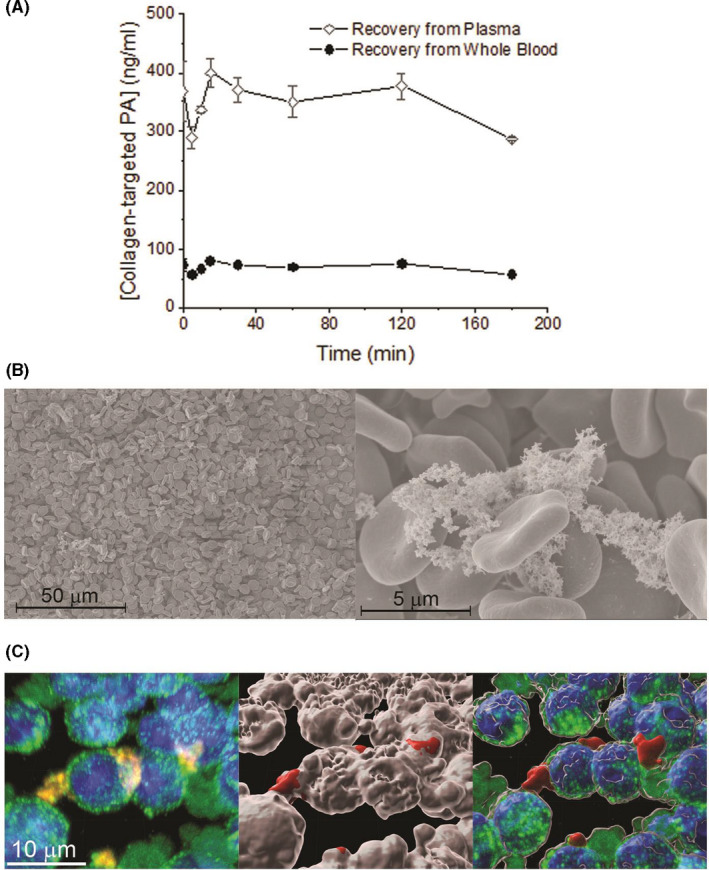
Figure 3.

(A) Collagen‐targeted PA concentration measured in plasma and whole blood after incubation at 37°C. (B) SEM of red blood cells exhibiting some nanofibers on the surface of RBCs. (C) Confocal microscopy exhibiting nanofibers associated with white blood cells (left). Green = CD45, blue = DAPI, and red = Alexa Fluor 546‐tagged nanofiber. Surface 3‐D rendering showing the CD45‐positive surface in white, and the Alexa Fluor‐positive in red (middle); overlay of maximal projection and surface rendering suggesting the cells are taking up the collagen‐targeted PA (right)
