Figure 3.

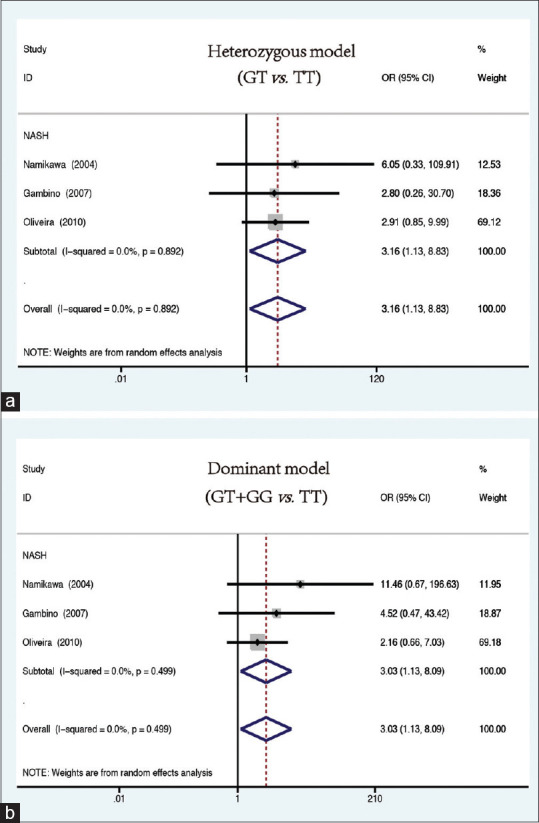
Forest plots for the association between MTTP rs1800591 xspolymorphism and NASH risk under the (a) heterozygous model (GT vs. TT) and (b) dominant model (GT + GG vs. TT)

Forest plots for the association between MTTP rs1800591 xspolymorphism and NASH risk under the (a) heterozygous model (GT vs. TT) and (b) dominant model (GT + GG vs. TT)