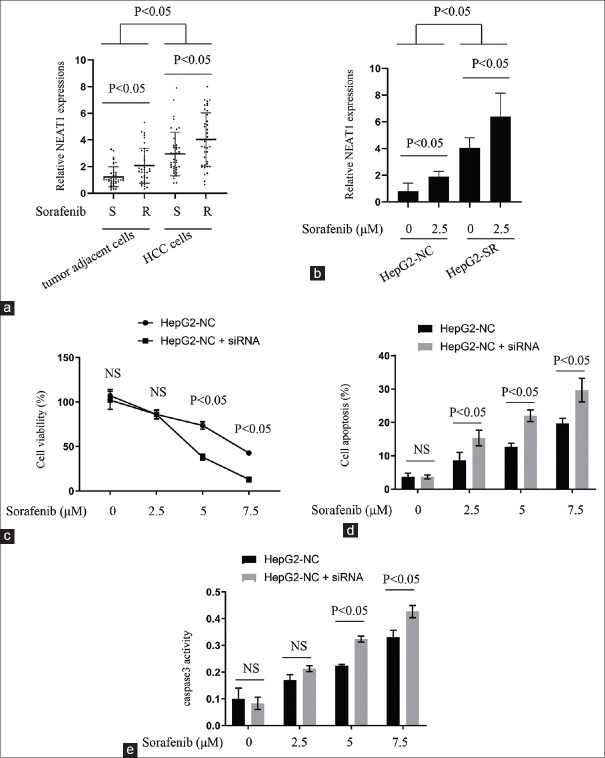
Figure 2.
Relationship between NEAT1 expressions and sorafenib resistance patterns. (a) qPCR results comparing NEAT1 levels between sorafenib sensitivity and resistance patterns in HCC tissues and adjacent tissues. (b) qPCR results comparing NEAT1 levels between sorafenib sensitivity and resistance patterns in HCC cell lines. (c-e) HepG2-NC cells transfected with NEAT1 siRNA or negative control, together with sorafenib treatment for 24 hours. (c) The cell viability of each group determined; (d) apoptosis rate of each group determined; (e) caspase-3 activity of each group determined

