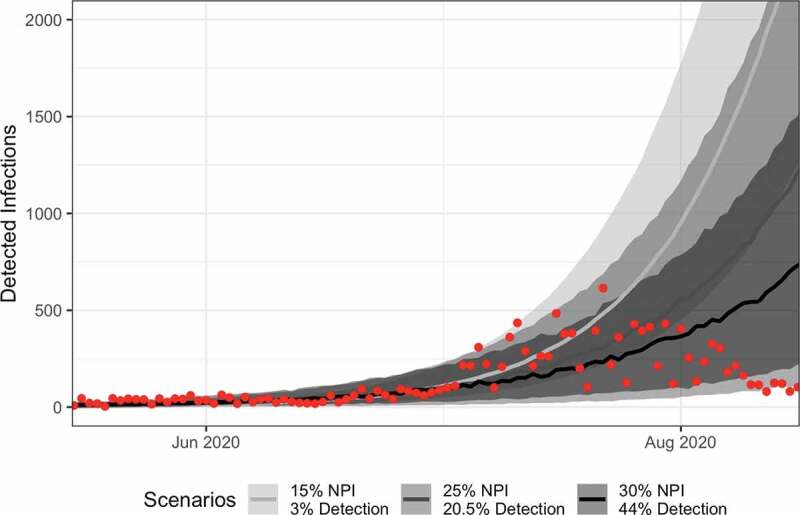
Figure 3.

The simple modeled scenarios can accurately explain early, but not later, epidemic dynamics in Madagascar. Time series of predictions from the three scenarios explored in Figure 2D are plotted here (median and 95% CI), with line-shade corresponding to the scenario. Reported case data from the Madagascar Ministry of Health are plotted in the red points.
