. 2020 Sep 11;142(11):111009. doi: 10.1115/1.4048191

Fig. 6.

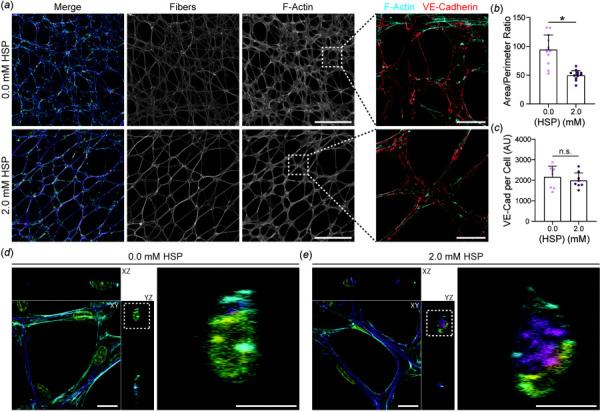
EC network formation on crimped DexVS matrices. (a) Confocal fluorescence images of ECs and fibers after 5 days of culture on low density DexVS matrices functionalized with variable HSP concentrations. F-actin (cyan), DexVS fibers (magenta), nuclei (yellow). Scale bar: 300 μm. Dashed boxes indicate locations of higher magnification images depicting VE-cadherin expression at cell-cell junctions. Scale bar: 50 μm. (b) Cell area/perimeter ratio (n = 12 fields of view) and (c) total VE-cadherin fluorescent intensity normalized to cell density (n = 8 fields of view) as a function of HSP concentration. Representative confocal fluorescent images and z-plane cross sections of tube-like structures in (d) control and (e) crimped matrix conditions. Scale bar: 10 μm. Dashed boxes indicate locations of higher magnification. Scale bar: 5 μm. All data presented as mean ± standard deviation; *p < 0.05.

EC network formation on crimped DexVS matrices. (a) Confocal fluorescence images of ECs and fibers after 5 days of culture on low density DexVS matrices functionalized with variable HSP concentrations. F-actin (cyan), DexVS fibers (magenta), nuclei (yellow). Scale bar: 300 μm. Dashed boxes indicate locations of higher magnification images depicting VE-cadherin expression at cell-cell junctions. Scale bar: 50 μm. (b) Cell area/perimeter ratio (n = 12 fields of view) and (c) total VE-cadherin fluorescent intensity normalized to cell density (n = 8 fields of view) as a function of HSP concentration. Representative confocal fluorescent images and z-plane cross sections of tube-like structures in (d) control and (e) crimped matrix conditions. Scale bar: 10 μm. Dashed boxes indicate locations of higher magnification. Scale bar: 5 μm. All data presented as mean ± standard deviation; *p < 0.05.