
Figure 1. Body-Mass Index over a Period of 20 Years in the Control and Surgery Groups.
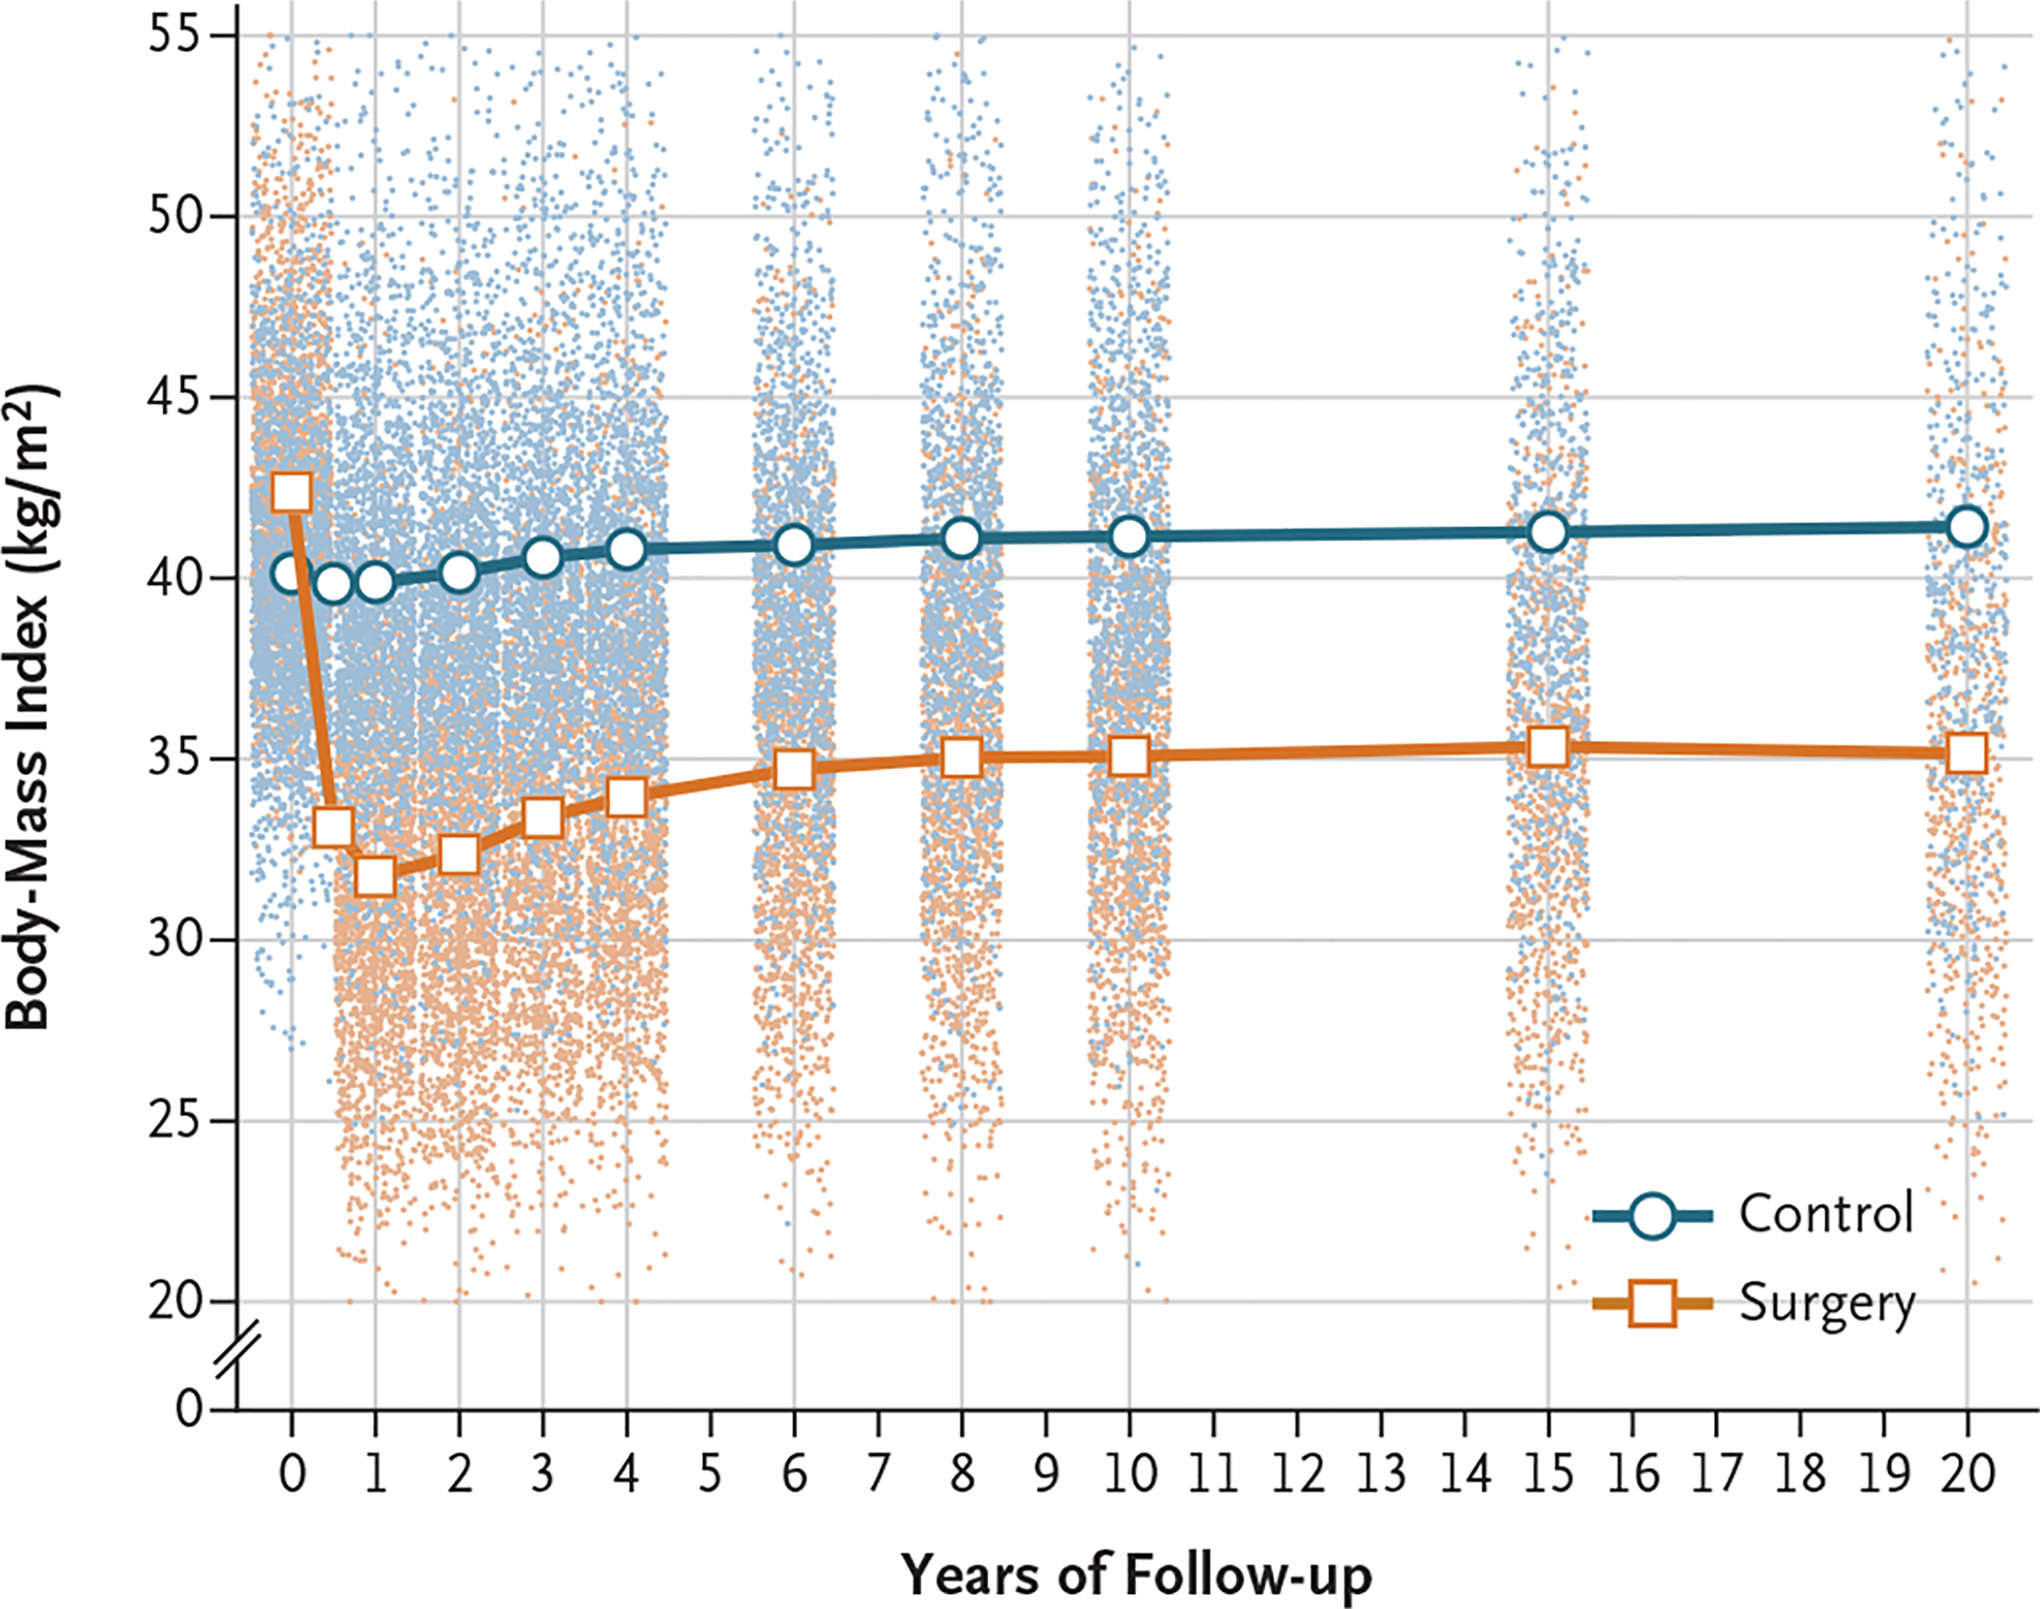
Lines are estimated means from a mixed model with adjustment for sex and age. Dots represent observed values from individual participants. The y axis is truncated at a body-mass index (the weight in kilograms divided by the square of the height in meters) of 20 and of 55, but all observations were used in the estimation of means.