
Fig. 6.
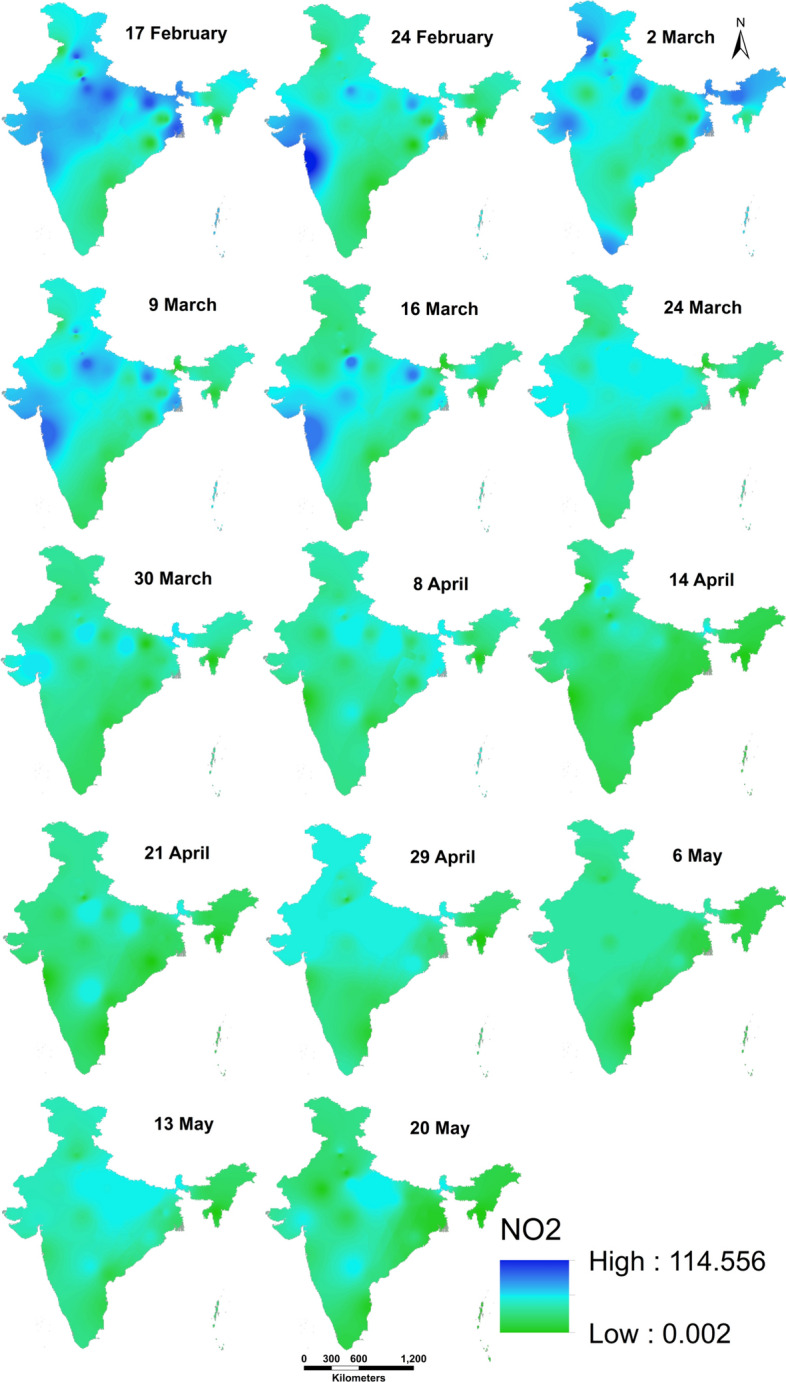
Spatial distribution of NO2 in before (17th February–16th March) and during lockdown (24th March–20th May) period
Official websites use .gov
A
.gov website belongs to an official
government organization in the United States.
Secure .gov websites use HTTPS
A lock (
) or https:// means you've safely
connected to the .gov website. Share sensitive
information only on official, secure websites.
Spatial distribution of NO2 in before (17th February–16th March) and during lockdown (24th March–20th May) period