Figure 5.

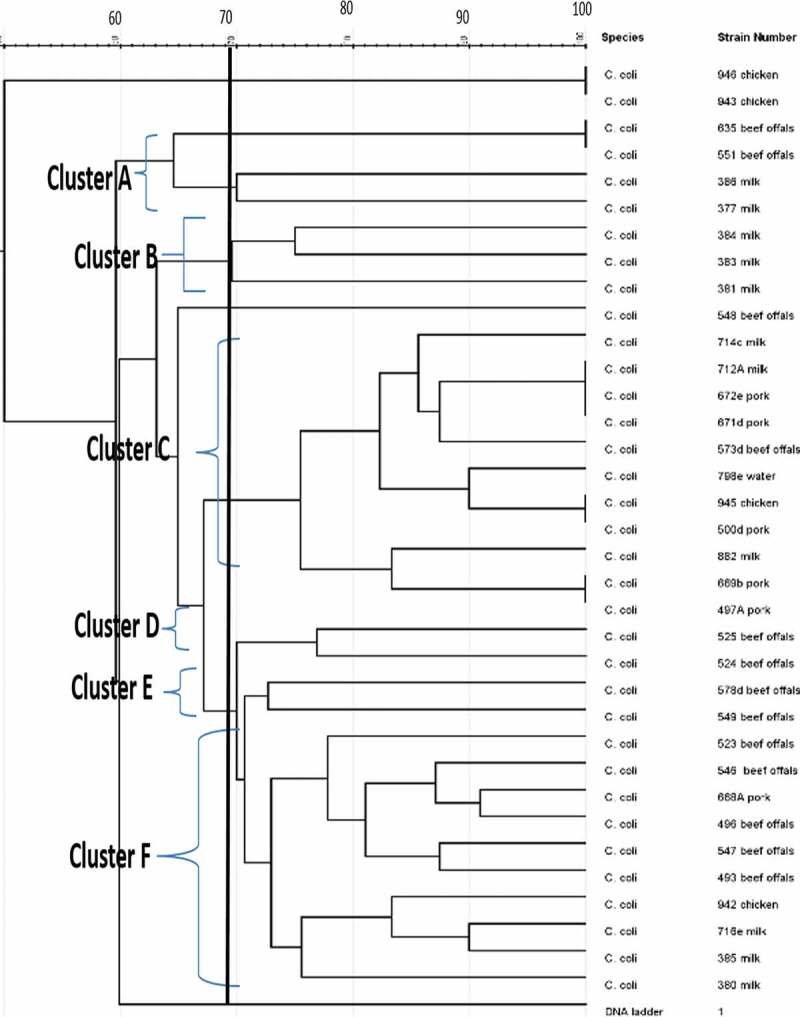
UPGMA dendrogram image obtained from cluster analysis showing the relationship and diversity of 35 C. coli isolates from different sources using ERIC-PCR technique.

UPGMA dendrogram image obtained from cluster analysis showing the relationship and diversity of 35 C. coli isolates from different sources using ERIC-PCR technique.