Figure 1.

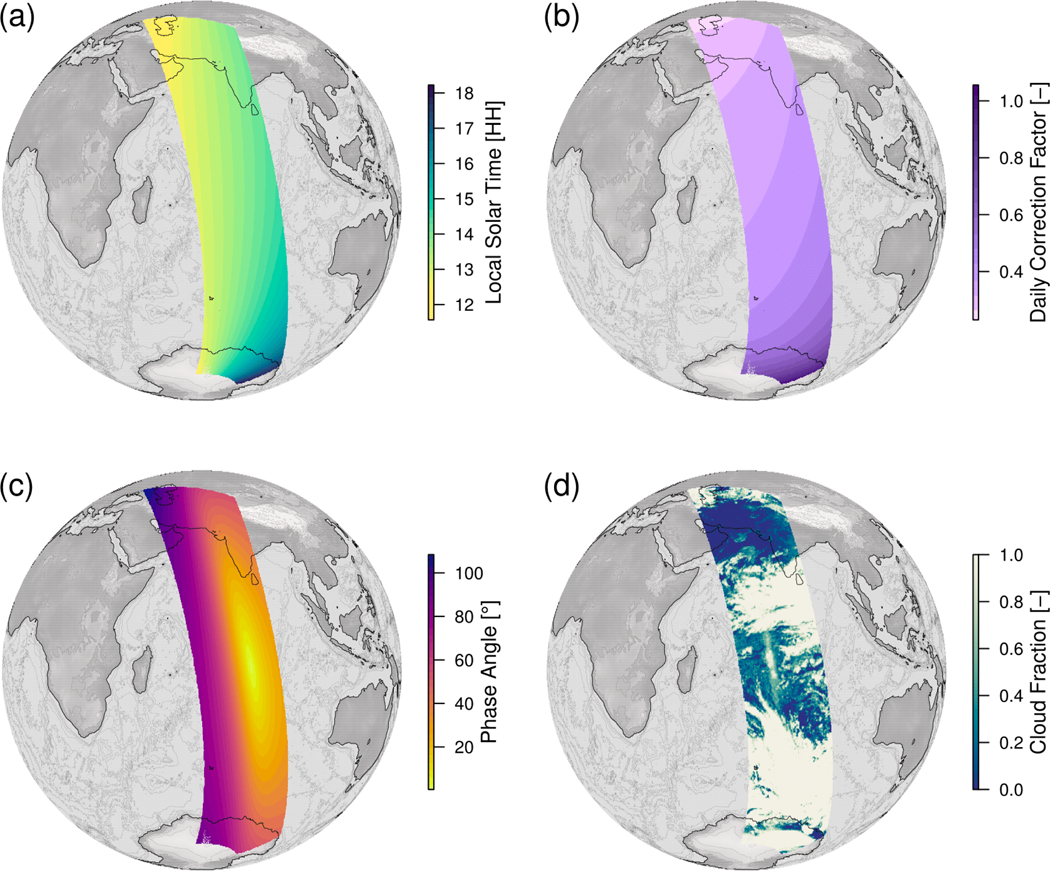
An arbitrary orbit (solar zenith angles lower than 70°) is shown to illustrate (a) local solar times, (b) daily correction factors from Eq.1, (c) observational phase angles, and (d) cloud fraction derived from co-located VIIRS-NPP data.

An arbitrary orbit (solar zenith angles lower than 70°) is shown to illustrate (a) local solar times, (b) daily correction factors from Eq.1, (c) observational phase angles, and (d) cloud fraction derived from co-located VIIRS-NPP data.