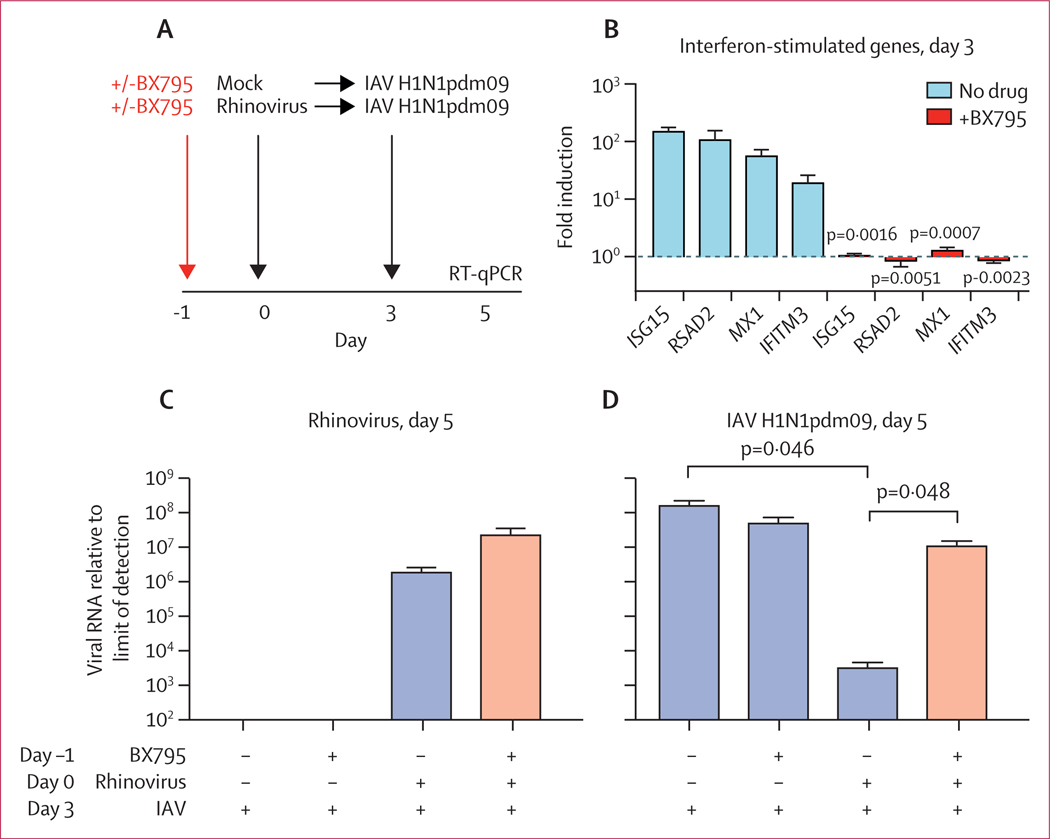
Figure 4: Effect of inhibiting antiviral signalling on rhinovirus–IAV interference.
Data are mean (SD) of four to five replicates per condition. (A) Timing of BX795 pre-treatment and sequential infections. (B) Expression of interferon-stimulated genes in rhinovirus-infected cultures on day 3, with or without BX795 pre-treatment. Bars show fold induction relative to mock treated cells. (C) Amount of rhinovirus RNA measured at day 5. (D) Amount of IAV RNA measured at day 5. The amount of viral RNA is expressed as fold change from the limit of detection. p values were calculated by t-test in B, C, and D. IAV=influenza A virus. RT-qPCR=reverse-transcription quantitative PCR.

