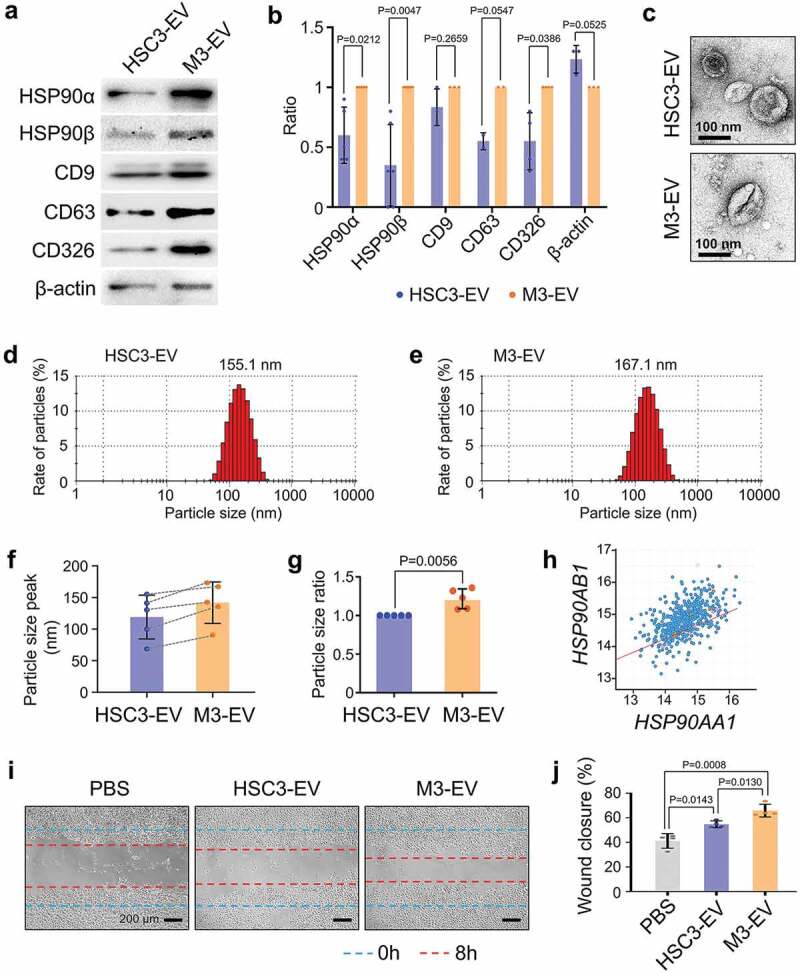
Figure 1.

Different characters of high- and low-metastatic oral cancer-derived EVs. (a) Western blotting showing HSP90α, HSP90β, tetraspanins (CD9, CD63), and CD326 in HSC-3-derived EVs (HSC3-EV) and HSC-3-M3-derived EVs (M3-EV). Similar data were obtained from three independent experiments. (b) Column scatters plotting to compare protein levels in HSC3-EV vs. M3-EV. Relative band intensities of Western blotting were plotted. (c) Representative TEM images of HSC3-EV and M3-EV. Scale bars, 100 nm. (d,e) Representative particle diameter distribution of (d) HSC3-EV and (e) M3-EV. (f) EV size peaks from five independent experiments. Dotted lines indicate the same sets of experiments. (g) The ratio of EV size peaks. (h) Scatter plot showing co-expression correlation between HSP90AA1 and HSP90AB1 in HNSCC. A regression line was shown in red. Data were represented as log2. The data set of head and neck squamous cell carcinoma (HNSCC) with 523 patient-derived 523 samples (TCGA, Pan-Cancer Atlas) was analysed using cBioPortal. (i,j) Wound healing assay of HSC-3 cells treated with PBS, HSC3-EV or M3-EV. (i) Representative images at 8 h after the wounding. --- (blue) initial wounds. --- (red) closed wounds at 8 h. Scale bars, 200 μm. (j) Rate of the wound closure. n = 4.
