Figure 8.

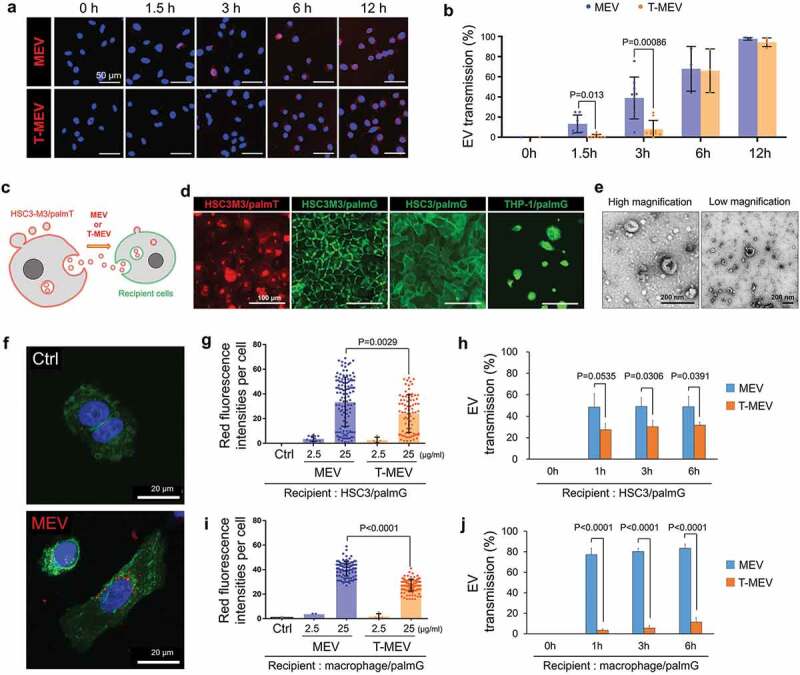
Triple knockdown of CDC37/HSP90α/HSP90β attenuates EV transmission potential into recipient macrophages and cancer cells. (a,b) Transmission of MEV and T-MEV into recipient HSC-3 cells. MEV was prepared from the culture supernatant of HSC-3-M3 transfected with si-Ctrl. T-MEV was prepared from the culture supernatant of HSC-3-M3 transfected with si-CDC37/90α/β. MEV and T-MEV were labelled with red-fluorescent ceramide and added to the culture media of HSC-3 cells. Cells were fixed at the indicated incubation period and analysed under fluorescent microscopy. (a) Representative images of vesicular transmission. Scale bars, 50 μm. Blue, DAPI staining. (b) The rate of EV transmission per total cells. N = 3. (c-j) Monitoring EVs labelled with membrane-bound palmitoylation (palm) signal-fused fluorescent proteins. (c) A scheme of the concept of fluorescent EV transmission. (d) Representative fluorescent images of HSC3M3/palmT, HSC3M3/palmG, HSC3/palmG and THP1/palmG cells. THP1/palmG was stimulated with PMA. Scale bars, 100 μm. (e) Representative TEM images of MEV released by HSC3M3/palmT cells. Scale bars, 200 nm. (f) Confocal laser scanning microscopy of HSC3/palmG cells treated with or without palmT-MEV. MEV (red) were prepared from culture media of HSC3 M3/palmT cells and added to the culture media of HSC3/palmG cells (green). Blue, DAPI staining. Scale bars, 20 μm. (g–j) MEV transmission rate into (g,h) HSC3/palmG cells or (i,j) THP1/palmG macrophages. For macrophage differentiation, THP1/palmG cells were stimulated with PMA. (g,i) Column scatters plotting of MEV transmission. The values indicate palmT fluorescence intensity per cell at 1 h after the addition of MEV or T-MEV. The upper end of each column indicates mean. (h,j) Transmission efficiencies of MEV vs. T-MEV into (h) HSC3/palmG cells and (j) THP1/palmG-derived macrophages. n = 3.
