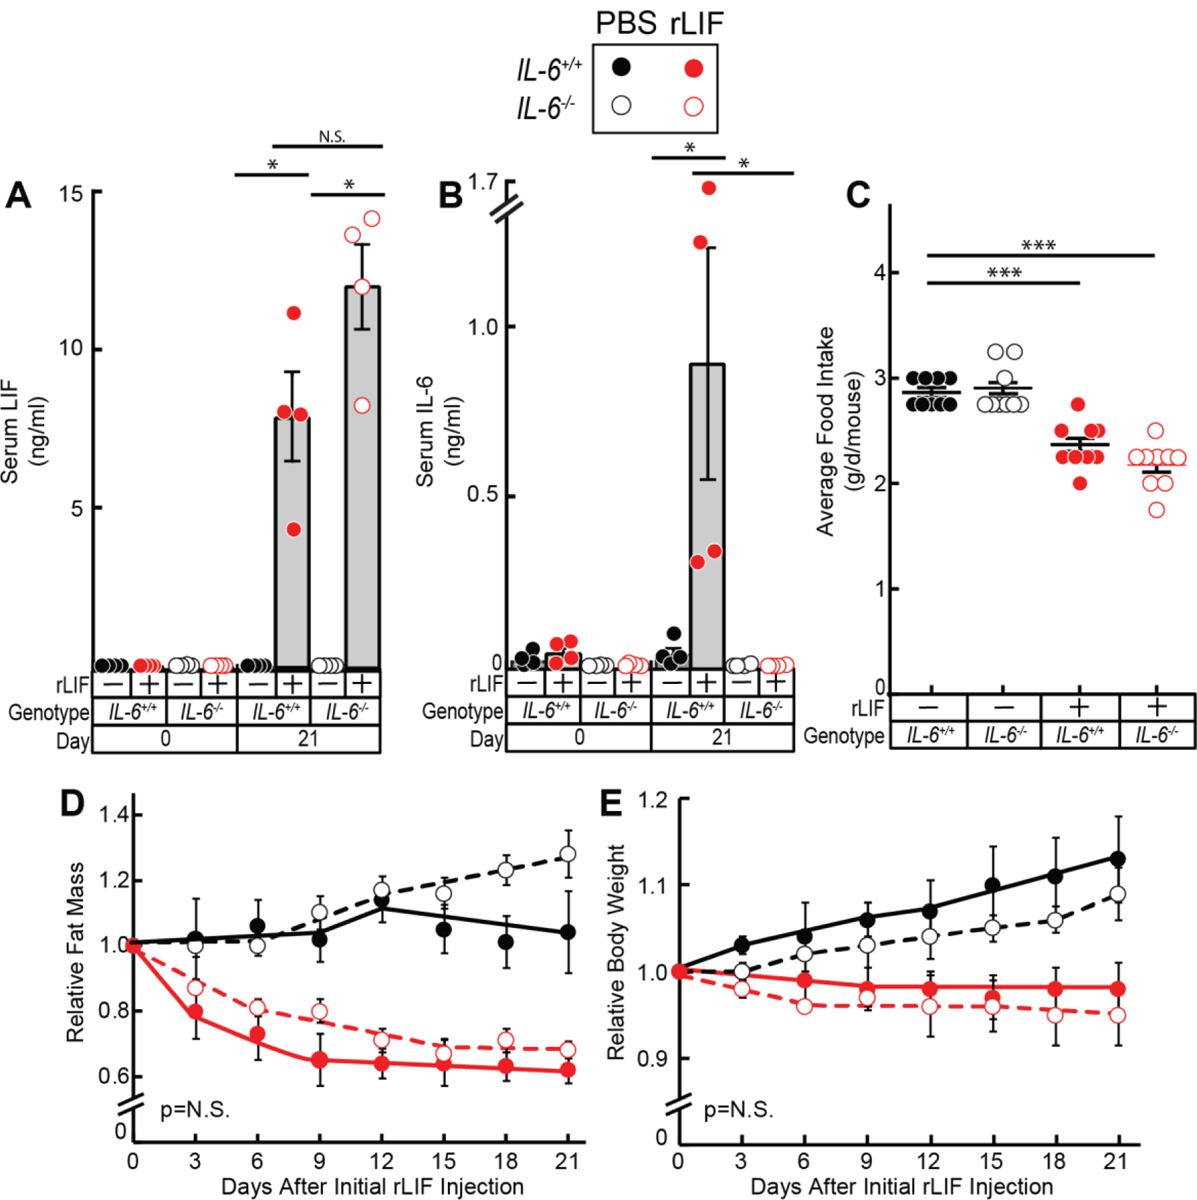
Figure 3. LIF Induces Cachexia-Associated Anorexia and Adipose/Body Weight Loss in IL-6−/− mice.

Chow-fed IL-6+/+ and IL-6−/− C57BL/6J mice (8-week-old males) were injected i.p. with PBS in the absence or presence of rLIF at 80 μg/kg body weight twice daily. Serum was collected on day 0 and day 21 for evaluation of LIF (A) and IL-6 (B) levels by ELISA as described in Methods. Food intake (C), ECHO MRI measurements of fat mass (D), and body weight (E) were measured at the indicated time points. Fat mass and body weight are shown relative to the average day 0 reference value for each respective cohort. The average values for fat mass at day 0 of the PBS- and rLIF- treated IL-6+/+ mice were 2.8 and 2.4 g, respectively, and for the IL-6−/− mice were 3.6 and 3.5 g, respectively. The average values for body weight at day 0 of the PBS- and rLIF- treated IL-6+/+ mice were 23 and 24 g, respectively, and for the IL-6−/− mice were 24 and 24 g, respectively. Data is shown as dot plots with mean ± SEM (A-C) or each value represents mean ± SEM (D-E) of four mice. *p<0.05 and ***p<0.001 based on Student’s t-test (A-C) or based on use of Generalized Estimating Equation approach comparing IL-6+/+ to IL-6−/− mice treated with either PBS or rLIF (D-E).
