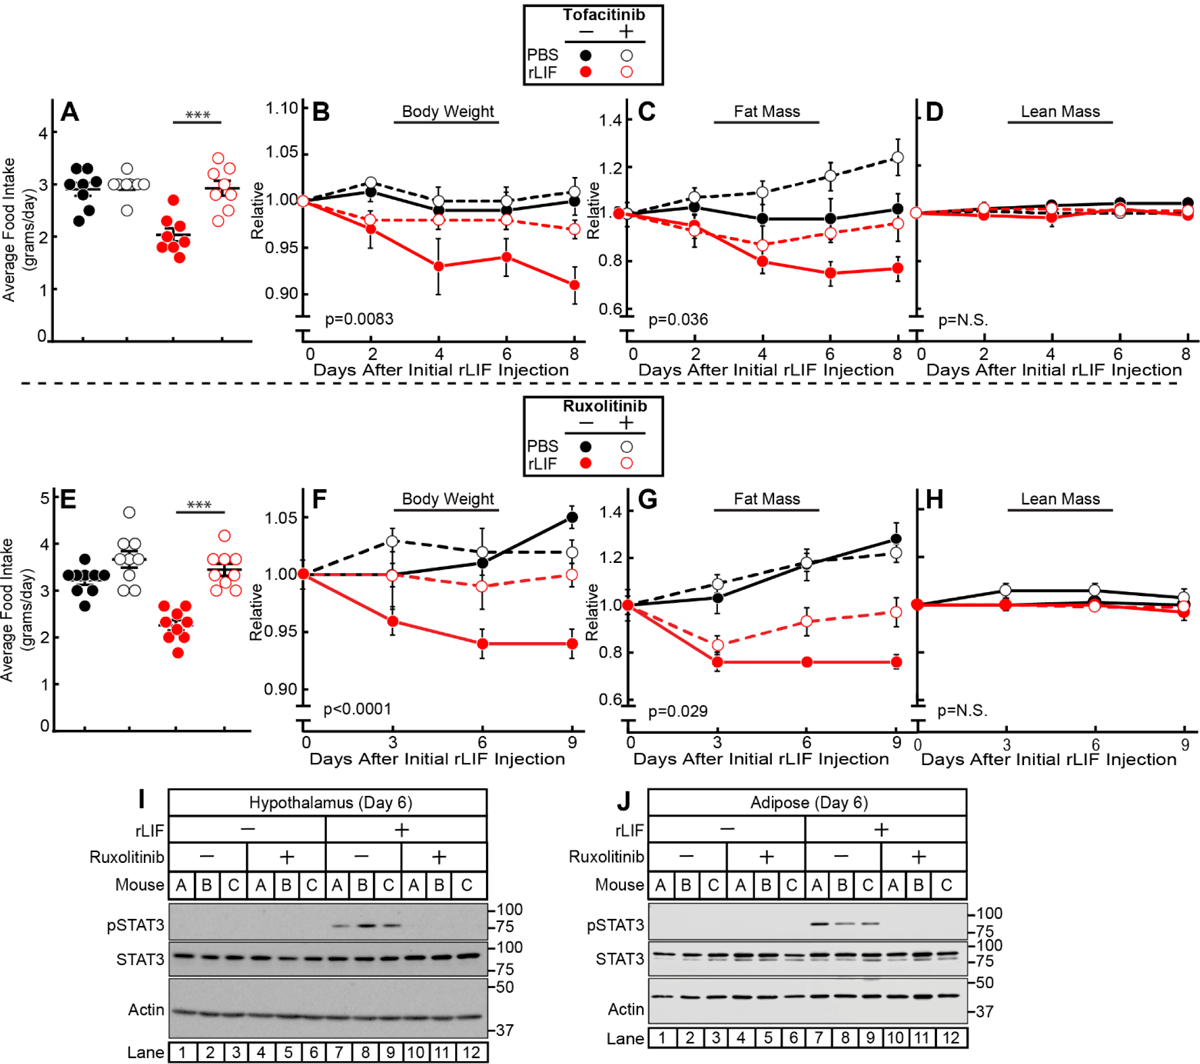
Figure 6. JAK Inhibition Suppresses rLIF-mediated Cachexia.

Chow-fed C57BL/6J mice (10-week-old males) were were injected i.p. with PBS in the absence or presence of rLIF at 80 μg/kg body weight twice daily. Ninety minutes after each rLIF injection, mice also received either oral gavage of 200 μl PBS containing 0.5% (v/v) methylcellulose and 0.1% (v/v) Tween 20 in the absence or presence of 25 mg/kg tofacitinib (A-D) or i.p. of 150 μl PBS containing 2% DMSO (v/v) and 30% PEG300 (v/v) in the absence or presence of 25 mg/kg ruxolitinib (E-J) twice daily. Food intake (A,E), body weight (B,F), ECHO MRI measurement of fat mass (C,G) and lean mass (D,H), or IB analysis of harvested hypothalamic (I) or adipose (K) tissue were measured at the indicated time points. Body weight, fat mass, and lean mass are shown relative to the average day 0 reference value for each respective cohort. The average values for day 0 for the PBS with vehicle, PBS with tofacitinib, rLIF with vehicle, and rLIF with tofacitinib were as follows: body weight (27, 25.4, 26.7, and 26.8 g), fat mass (3.6, 3.4, 3.7, and 3.6 g) and lean mass (19, 18, 18.7, and 19 g), respectively. The average values for day 0 for the PBS with vehicle, PBS with ruxolitinib, rLIF with vehicle, and rLIF with ruxolitinib were as follows: body weight (26.5, 28, 26.4, and 27 g), fat mass (2.7, 3.0, 3.0, and 2.8 g) and lean mass (20, 21, 20, and 21 g), respectively. Data is shown as dot plots with mean ± SEM (A and E) or each value represents the mean ± SEM (B-D,F-H) of four (A-D) or three (E-H) mice. These results were confirmed in at least three independent experiments.
