FIGURE 2.
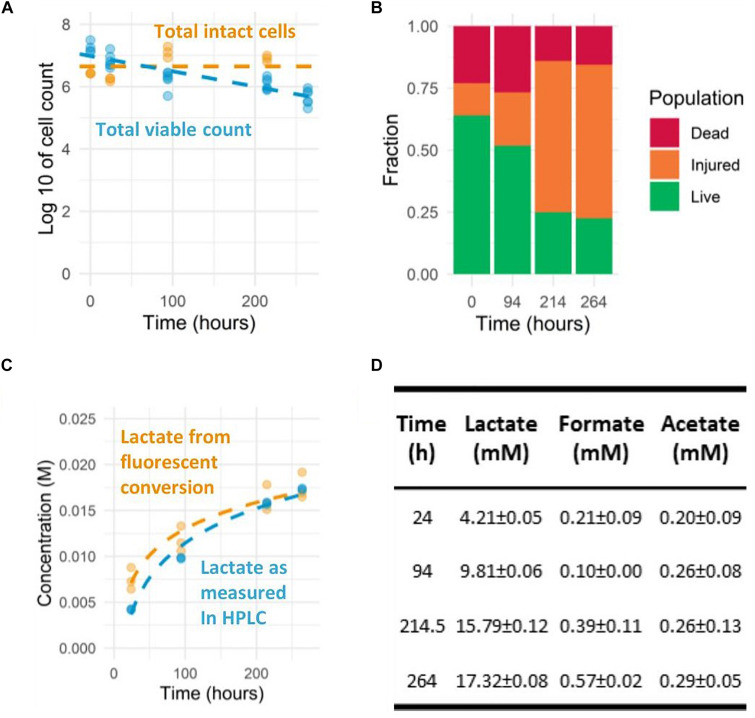
Prolonged observation of L. lactis NCDO712 pre-cultured in CDMpc-lactose 1%, harvested at mid-exponential growth and transferred to the assay medium with lactose 1%. (A) Colony forming units and intact cell count as measured by flow-cytometry. (B) The different cell fractions of the life-dead staining as measured by flow-cytometry. (C) Lactate accumulation derived from fluorescent measurements and HPLC determination show good agreement (R-squared value of 0.94) (dashed lines indicate semi-logarithmic fit). (D) The organic acid production profiles as determined by HPLC were dominated by lactic acid throughout the experiment.

