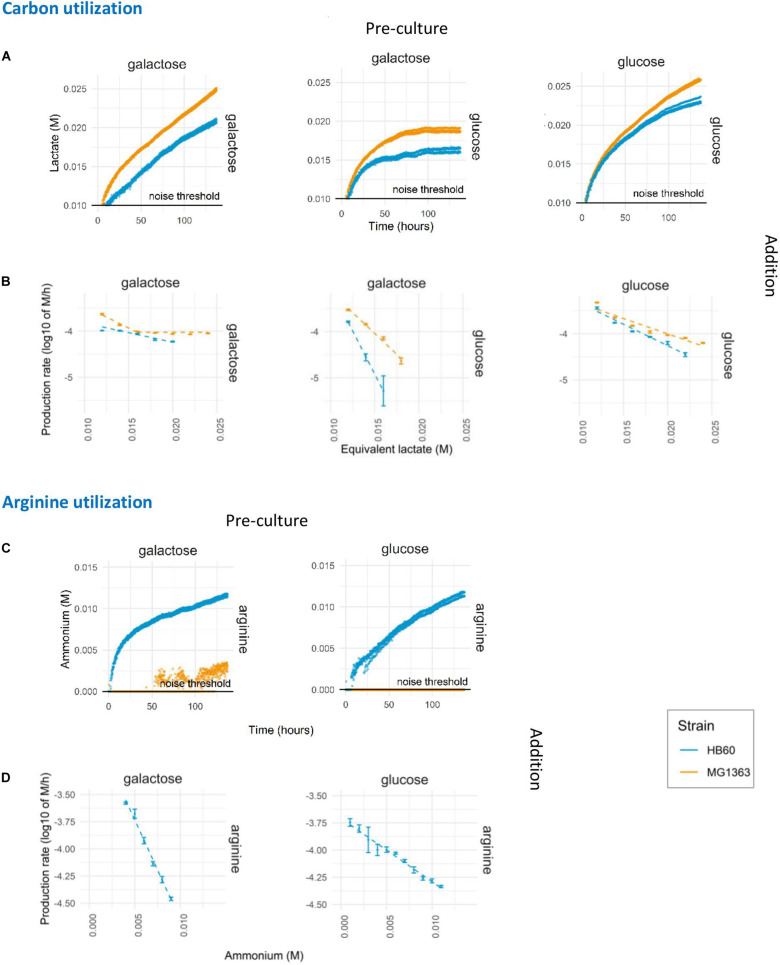
FIGURE 3.
Prolonged assay of carbon and arginine utilization. L. lactis MG1363 (orange) and HB60 (blue) were harvested at mid-exponential growth following pre-culture (top label) in 1% w/v of glucose or galactose and subsequently transferred to translationally blocked assay mediums with different carbon source (right side label) at 2.0E+07/mL cell density. (A) Lactate production. (B) The decline in lactate production rates. (C) Ammonium production. (D) The decline in ammonium production rates. Dashed lines indicate the linear fits of the data. Noise threshold was determined from the non-biological fluctuation of signal based on a negative control at pH 6.5 (lactate production) and pH 5.5 (ammonium production). Error bars indicate standard deviation of the experiment (n = 4).

