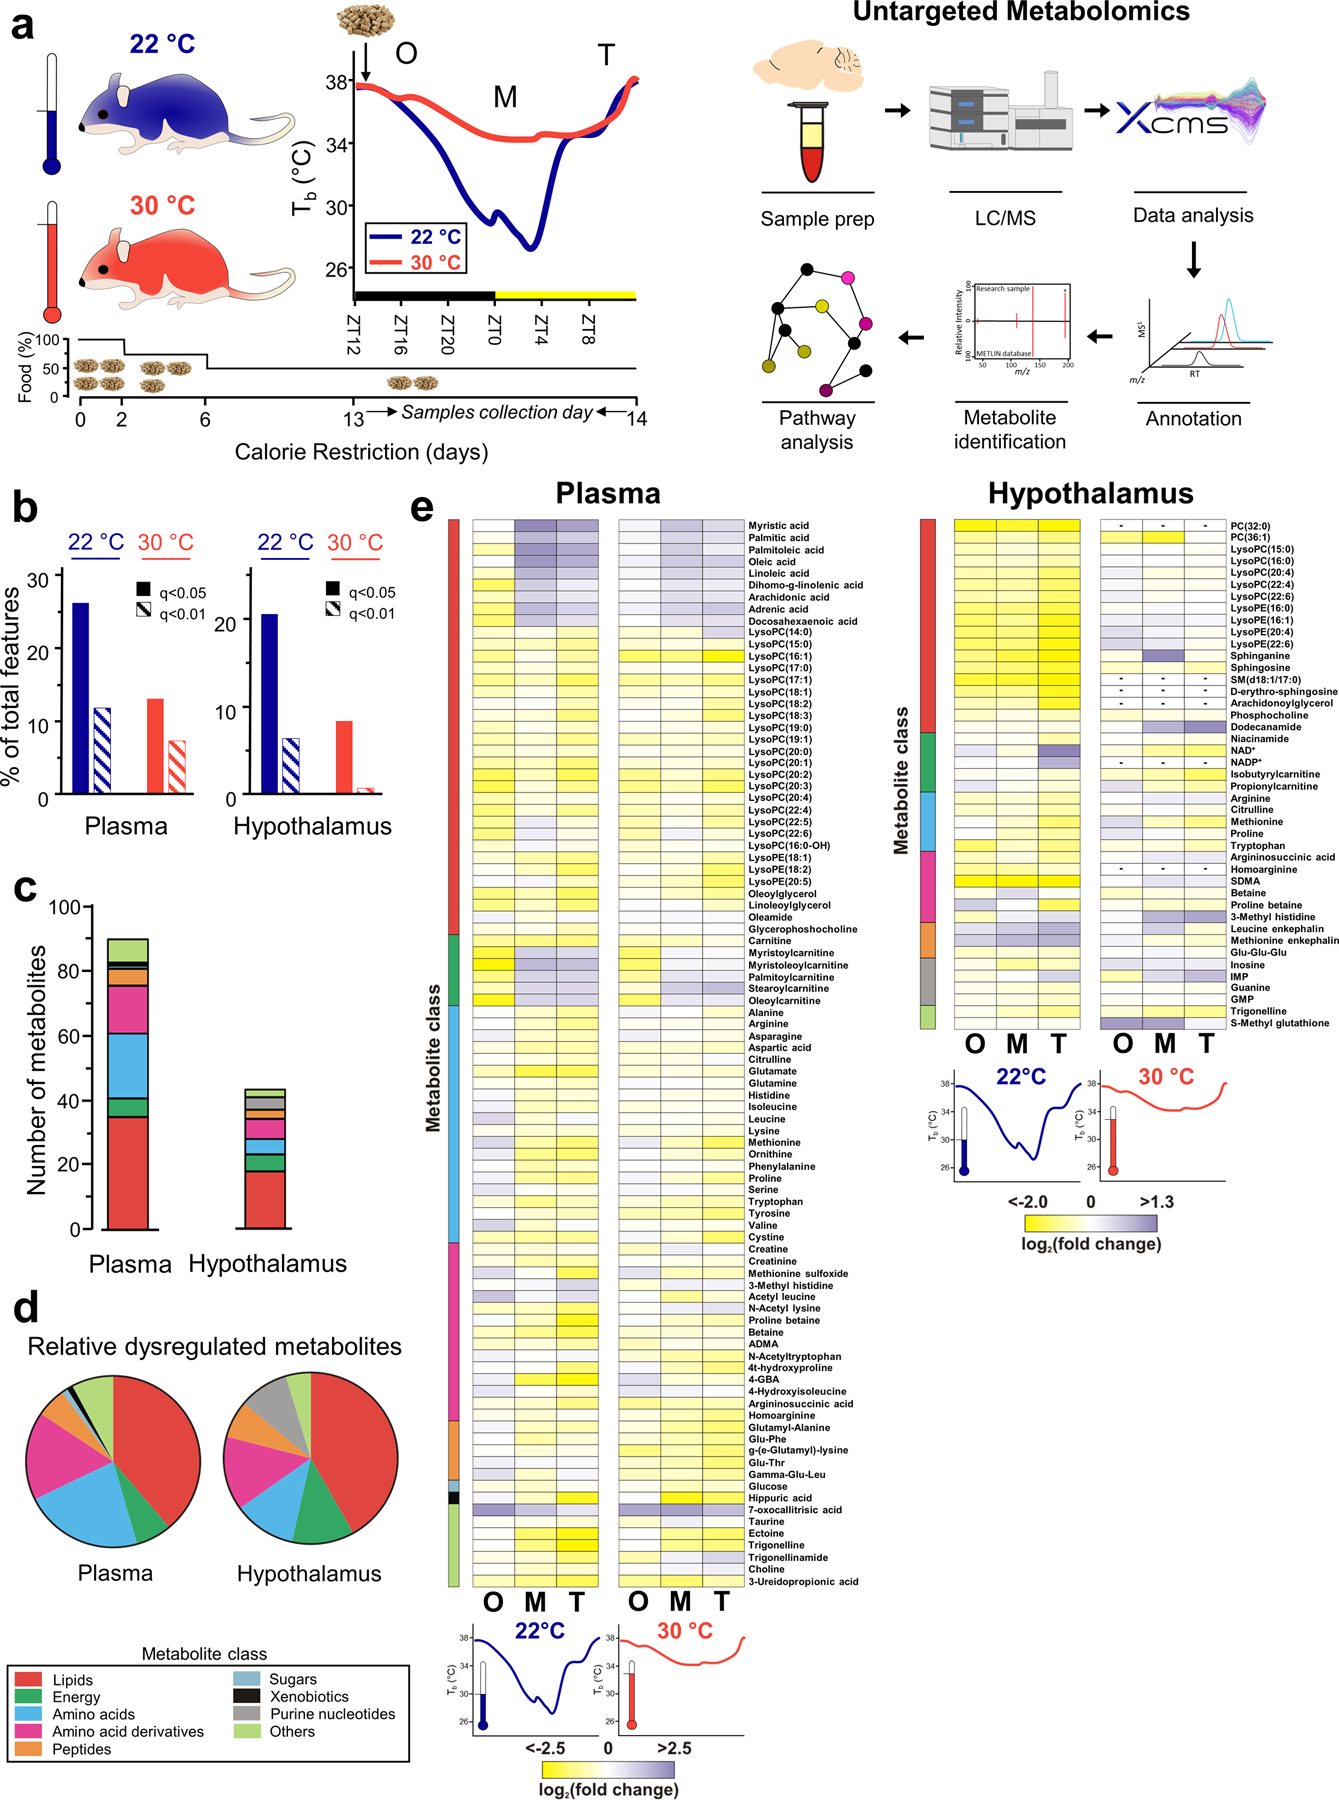
Figure 1. EXPERIMENTAL SETUP AND OVERVIEW OF UNTARGETED METABOLOMICS RESULTS.

(a) Calorie restriction setup with sample collection points and untargeted metabolomics workflow. N=10 mice for each group, except for AL at 22 °C (N=9). O: onset. M: maintenance. T: termination. ZT: Zeitgeber time. (b) Percentage of statistically altered metabolic features at both temperatures for plasma and the hypothalamus. Features with an intensity over 5,000 counts were considered for the analysis. Isotopes were removed prior to these calculations. (c-d) Total number (c) and relative distribution (d) among classes of altered metabolites found in plasma and the hypothalamus. (e) Metabolite changes were calculated using ad libitum-fed mice as control for both temperatures and represented in a heatmap using a logarithmic scale. ADMA: Asymmetric dimethylarginine; 4-GBA: 4-Guanidinobutanoic acid; SDMA: Symmetric dimethylarginine; IMP: Inosine monophosphate; GMP: Guanosine monophosphate.
