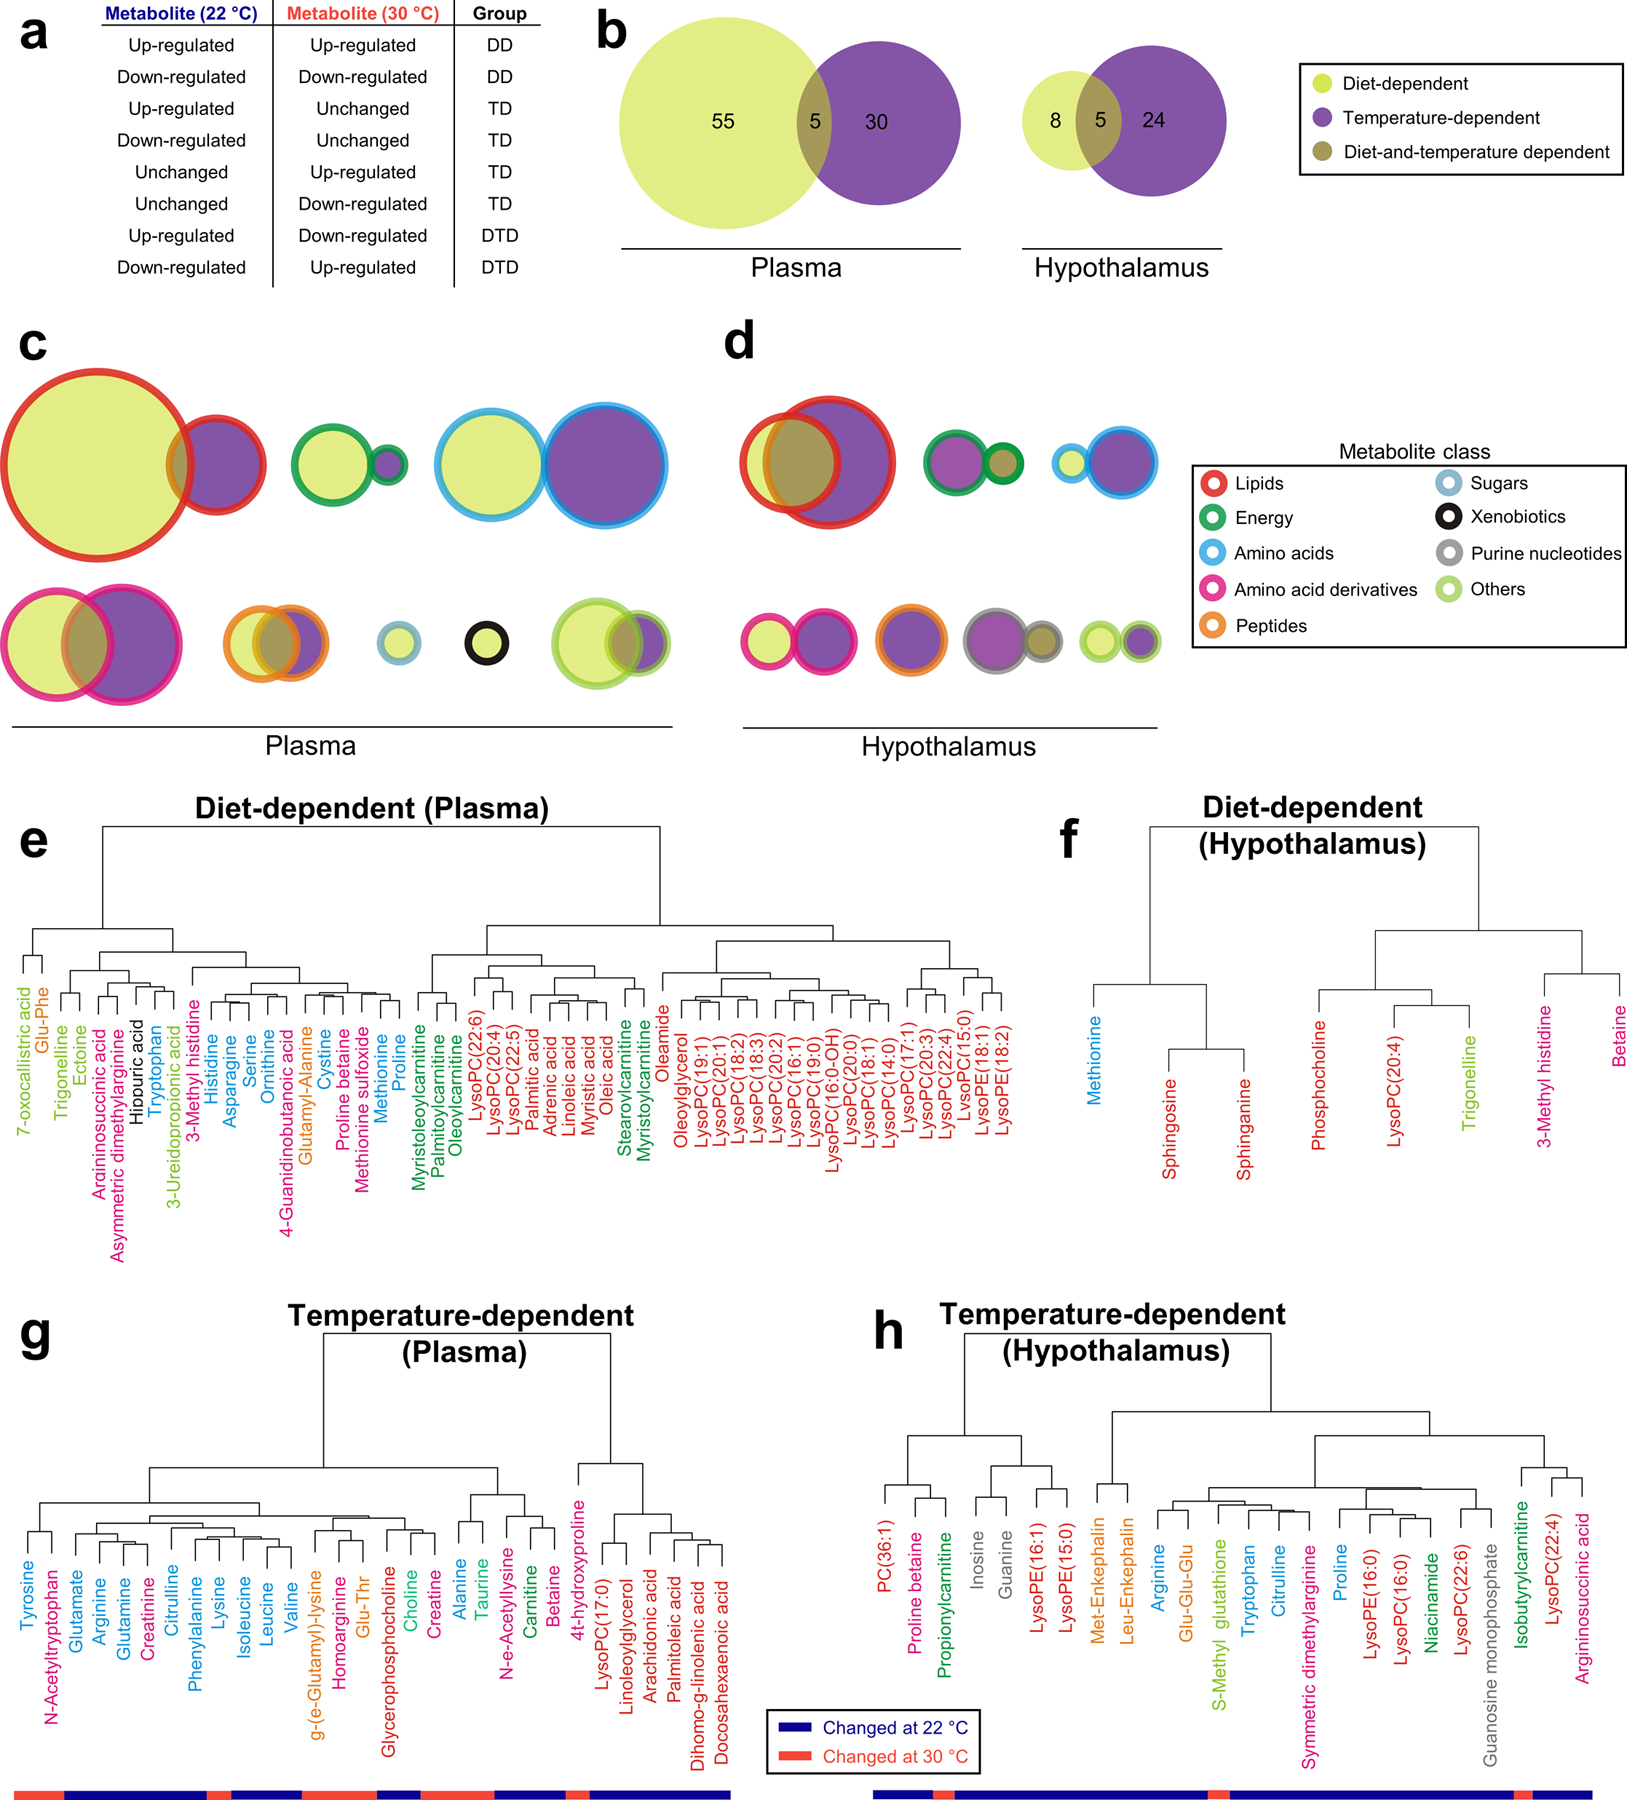
Figure 2. Classification of metabolites based on the impact of diet or/and temperature.

(a) Classification of metabolites according to their computational calculated trend during calorie restriction. DD: Diet-dependent. TD: Temperature-dependent. DTD: Diet- and temperature-dependent. (b) Total number of metabolites altered due to diet, temperature or both in plasma and the hypothalamus. (c-d) Number of metabolites changed due to food deprivation, temperature or both by metabolite class in plasma (c) and the hypothalamus (d). Size of circles is proportional to the total number of metabolites of each class. (e-h) Hierarchical clustering of metabolites sorted in different classes: Diet-dependent in plasma (e) and the hypothalamus (f) and temperature-dependent in plasma (g) and the hypothalamus (h).
